Highlight Cell Data with Conditional Formatting

December 6, 2023
Apply visual cues to specific cells, rows, or columns based on their data values, making it easier to identify patterns and trends.

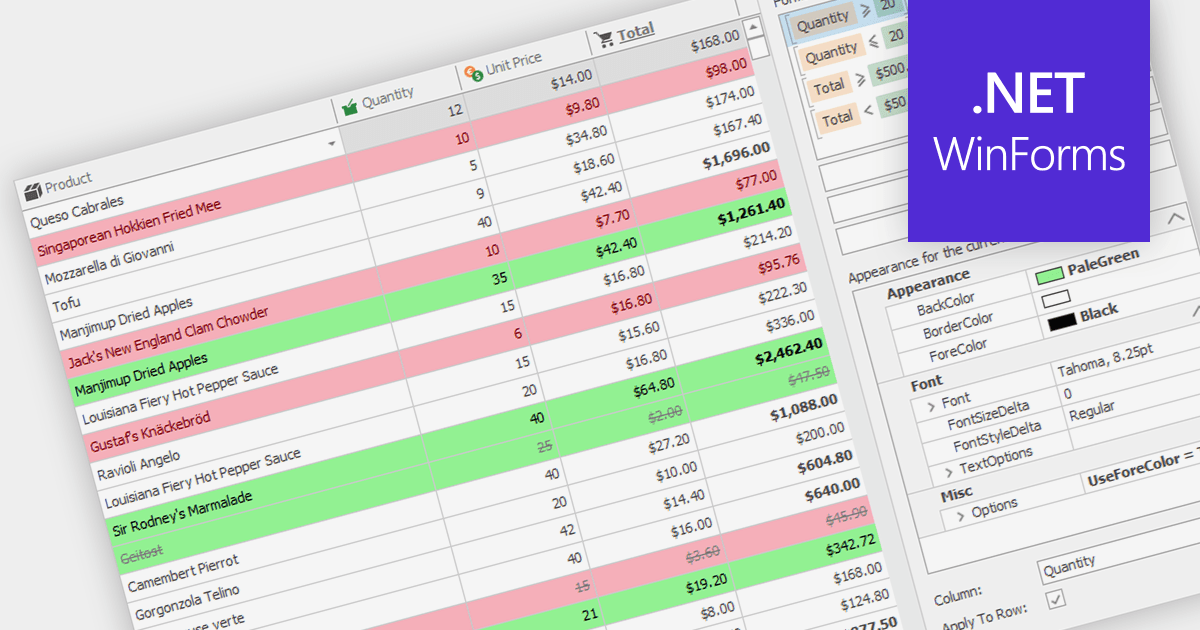
Conditional formatting in grids allows users to apply visual styles to cells or ranges based on the data they contain. It enhances data readability and analysis by highlighting critical values, outliers, or trends in a data-driven manner. For instance, a cell might be colored red if it contains a value below a certain threshold, thereby drawing attention to potential issues.

Several WinForms grid components support conditional formatting including:

  • DevExpress WinForms Data Grid (part of DevExpress WinForms) enhances data visualization with rich conditional formatting rules including custom visual styles.
  • FlexGrid for WinForms (part of ComponentOne Studio WinForms by MESCIUS) enables conditional cell styles, visual indicators and data-driven formatting.
  • Infragistics WinDataGrid (part of Infragistics Ultimate UI for Windows Forms) includes sophisticated formatting rules, conditional cell backgrounds, and data-driven visual cues.
  • NOV Grid for .NET (part of Nevron Open Vision for .NET) provides custom formatting expressions, data-driven cell styles and conditional background colors.
  • Telerik UI for WinForms GridView offers rule-based cell formatting, visual indicators, and data-driven formatting logic.

For an in-depth analysis of features and price, visit our WinForms Grid comparison.

Compare WinForms Grid Components