


Official Supplier
As official and authorized distributors, we supply you with legitimate licenses directly from 200+ software publishers.
See all our Brands.
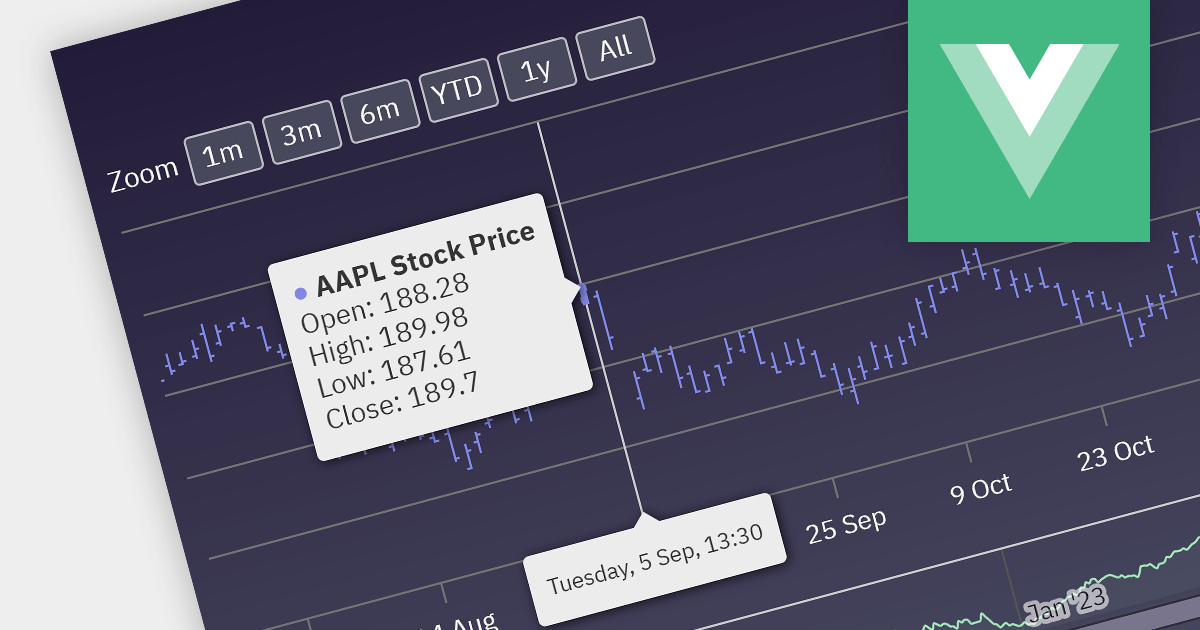
Financial apps can be significantly enriched by integrating open-high-low-close charts. These versatile visualizations condense price movement data into clear, concise bars, empowering users to rapidly grasp market trends and identify potential trading opportunities. With a quick glance, users can assess open, high, low, and closing prices within a chosen timeframe, gaining valuable insights into market sentiment and volatility. This immediate understanding fosters informed decision-making, transforming your Vue.js app into a dynamic platform for financial analysis and informed action.
Several Vue.js chart controls offer OHLC charts including:
For an in-depth analysis of features and price, visit our Vue.js chart controls comparison.


Tel: (888) 850 9911
Fax: +1 770 250 6199


