


Official Supplier
As official and authorized distributors, we supply you with legitimate licenses directly from 200+ software publishers.
See all our Brands.
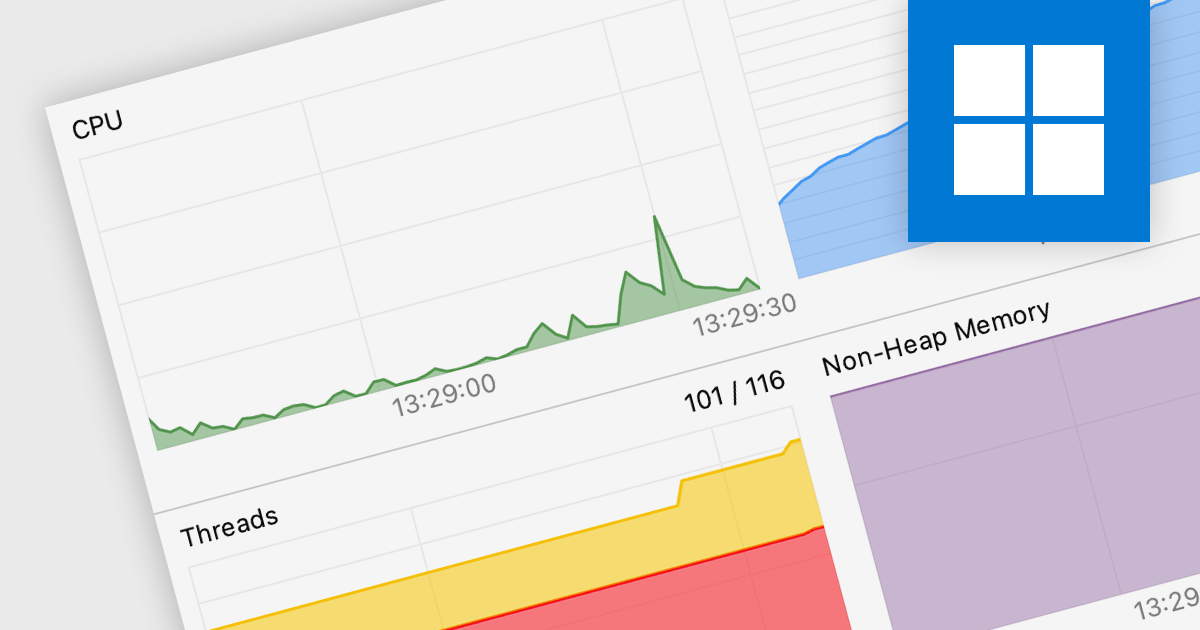
Code profiling is a diagnostic technique employed to analyze the runtime behavior of an application. It dissects resource consumption, usually including CPU time, memory allocation, and function call frequency, to precisely identify performance bottlenecks and resource hogs. Armed with these insights, developers can optimize specific code sections, leading to improved user experience, resource efficiency, and ultimately, a more robust and performant application.
Several IDEs support code profiling, including:
For an in-depth analysis of features and price, visit our IDEs comparison.


Tel: (888) 850 9911
Fax: +1 770 250 6199


