


Official Supplier
As official and authorized distributors, we supply you with legitimate licenses directly from 200+ software publishers.
See all our Brands.
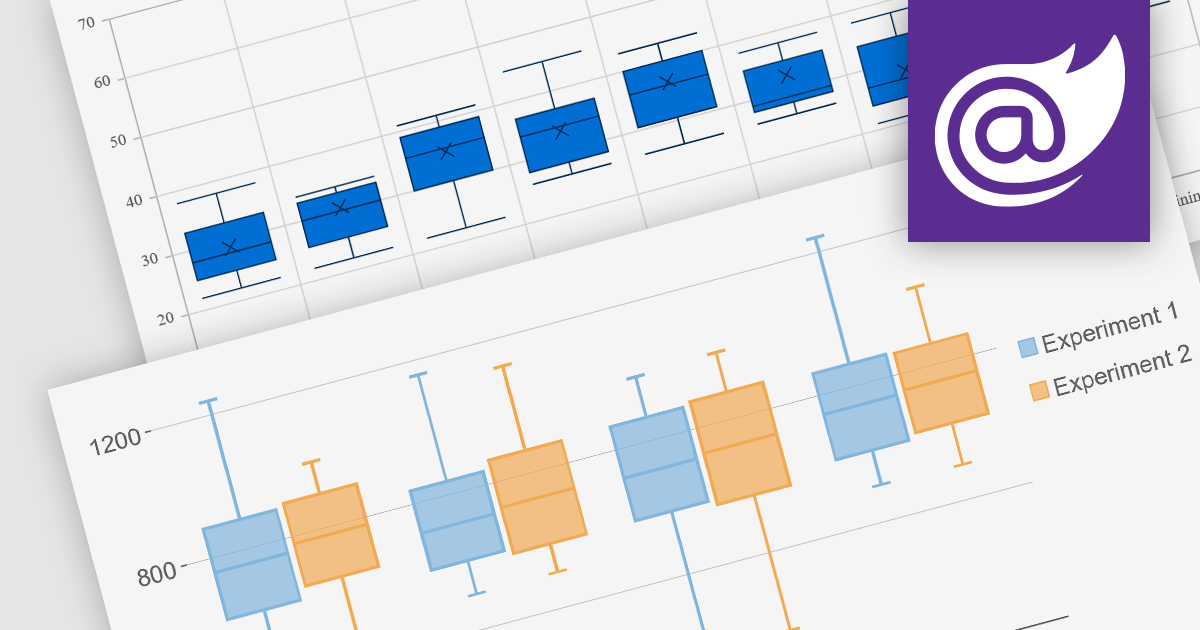
Box plots, also known as box-and-whisker plots, are used to display the distribution of a dataset. They show the median, quartiles, and extremes of the data, providing a quick visual summary of the data's central tendency and variability. This makes them particularly useful for statistical analysis and comparing data across categories.
Several Blazor chart controls offer Box plots including:
For an in-depth analysis of features and price, visit our Blazor chart controls comparison.


Tel: (888) 850 9911
Fax: +1 770 250 6199


