


Official Supplier
As official and authorized distributors, we supply you with legitimate licenses directly from 200+ software publishers.
See all our Brands.
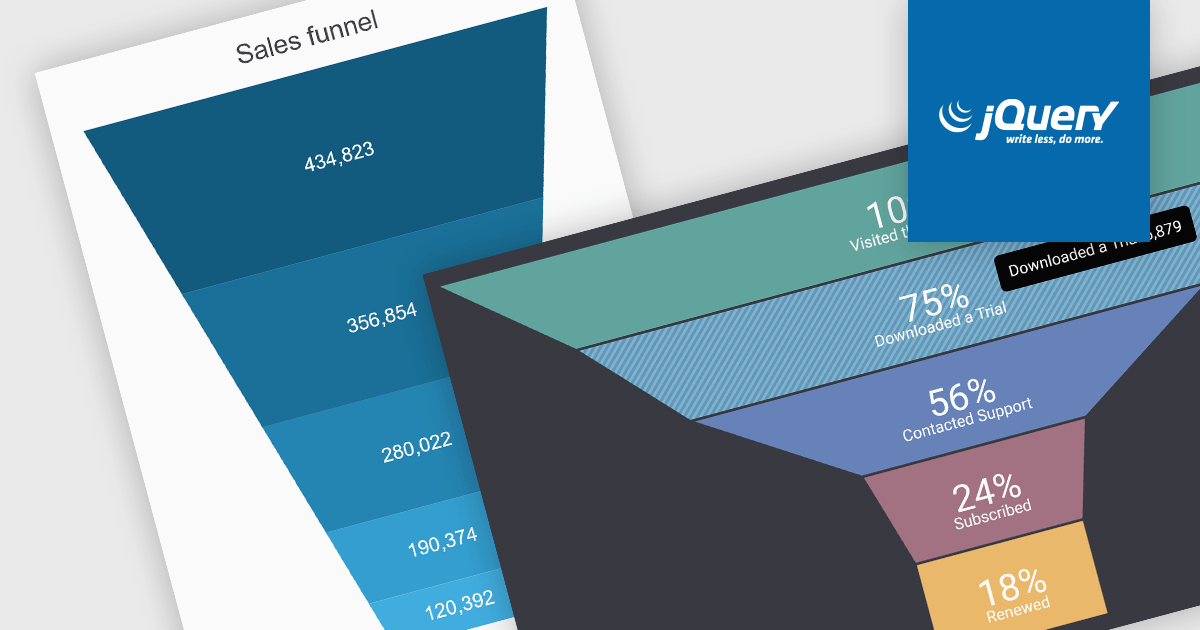
A funnel chart is a type of visualization that graphically depicts the stages of a process and the progressive flow of values through those stages. It gets its name from its shape, typically resembling a funnel with a wide top and narrow base. Funnel charts are particularly useful in sales and marketing contexts for tracking potential customers as they move through the sales pipeline, identifying bottlenecks, and pinpointing areas where performance might be improved.
Several jQuery chart controls offer Funnel charts including:
For an in-depth analysis of features and price, visit our jQuery chart controls comparison.


Tel: (888) 850 9911
Fax: +1 770 250 6199


