


Official Supplier
As official and authorized distributors, we supply you with legitimate licenses directly from 200+ software publishers.
See all our Brands.
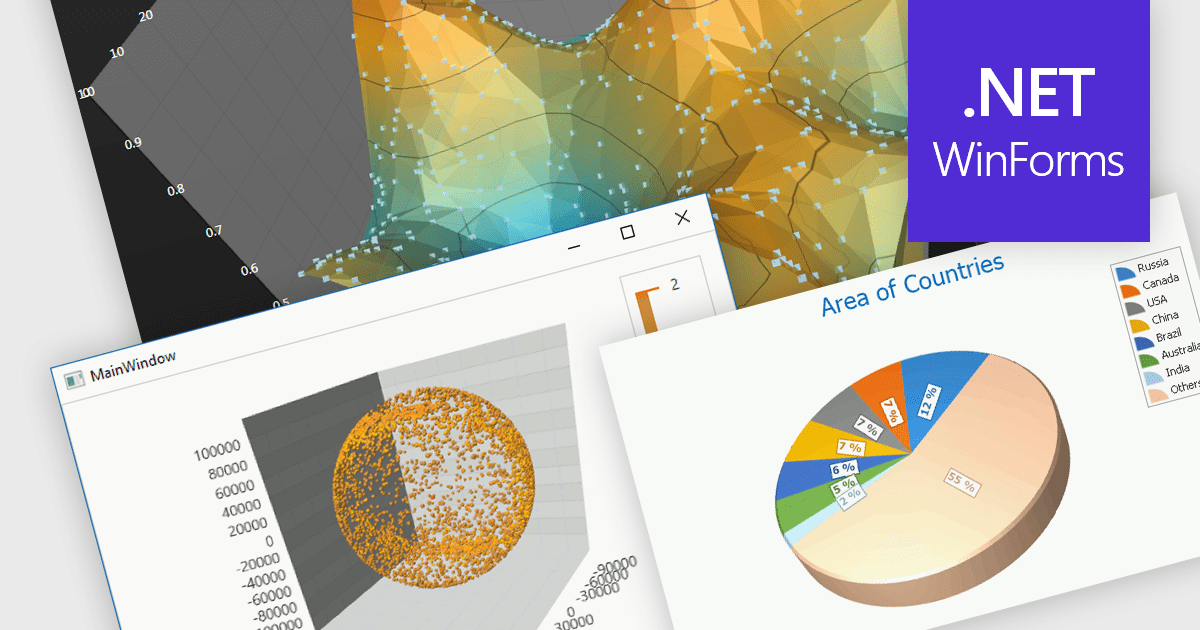
3D charts excel at showcasing complex datasets with three variables. By adding depth, they allow viewers to grasp intricate relationships between these variables that might be difficult to decipher in a flat, 2D format. This enhanced visualization can reveal patterns and trends that would otherwise remain hidden, leading to a deeper understanding of the data.
Several WinForms Chart controls offer 3D charts including:
For an in-depth analysis of features and price, visit our WinForms Chart controls comparison.


Tel: (888) 850 9911
Fax: +1 770 250 6199


