


Official Supplier
As official and authorized distributors, we supply you with legitimate licenses directly from 200+ software publishers.
See all our Brands.
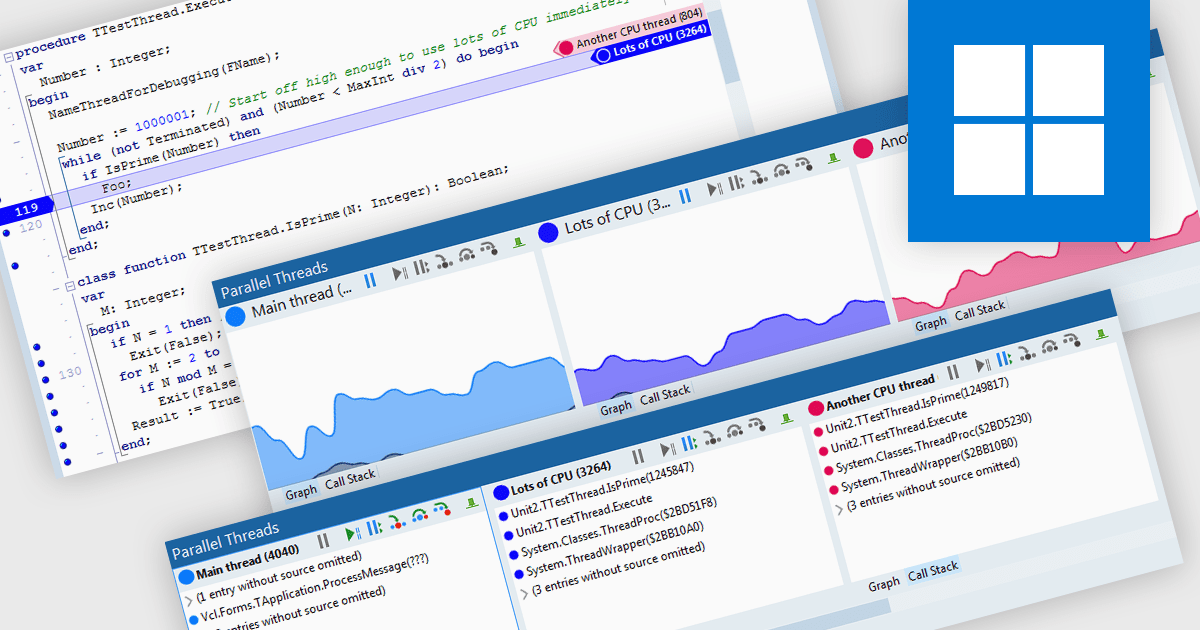
Code threading enables concurrent execution of multiple tasks within a single program, sharing resources. Each thread acts as an independent mini-program, often implemented through subroutine calls. This approach improves application responsiveness (for example syntax highlighting while compiling code) and CPU utilization but necessitates careful debugging due to complexities in thread scheduling. Debugging threaded code is crucial for ensuring software reliability and performance as it tackles issues arising from interactions and timing between these concurrent threads.
Several integrated development environments allow you to debug threaded code, including:
For an in-depth analysis of features and price, visit our comparison of IDEs.


Tel: (888) 850 9911
Fax: +1 770 250 6199


