


Official Supplier
As official and authorized distributors, we supply you with legitimate licenses directly from 200+ software publishers.
See all our Brands.
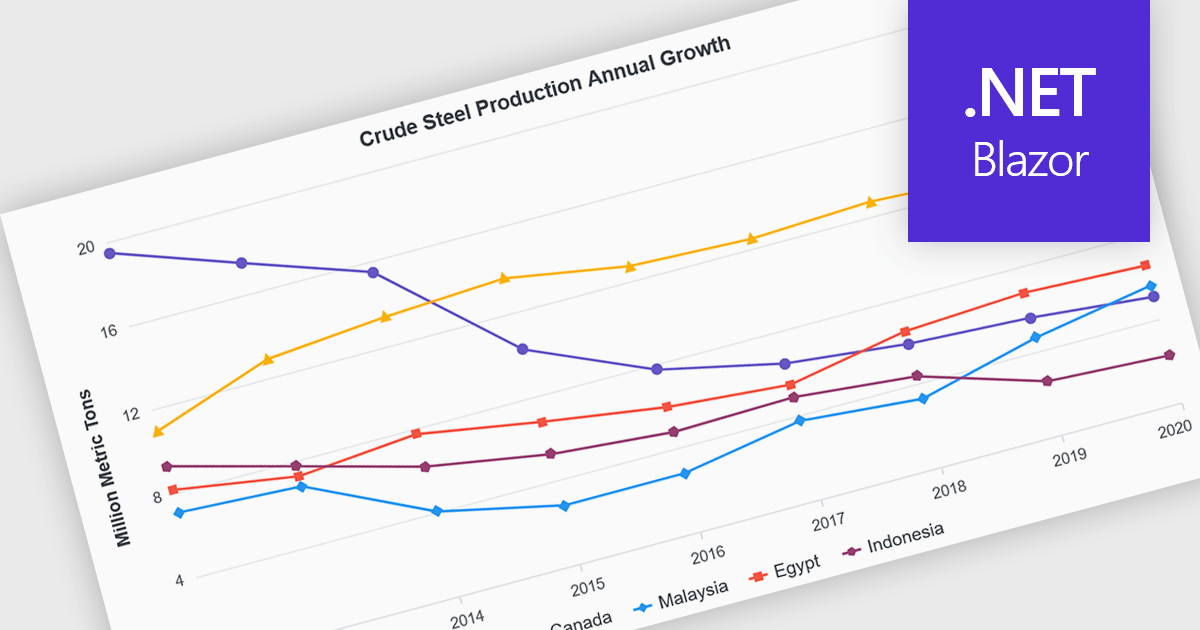
Line charts are visual representations of data points connected by lines, often used to illustrate trends, patterns, or changes over time. They are particularly effective for displaying continuous data sets, such as stock prices, temperature variations, or sales figures. By connecting data points, line charts provide a clear and intuitive understanding of how values evolve over a specific period. This visual representation aids in identifying trends, making comparisons, and predicting future outcomes.
Several Blazor chart controls offer line charts including:
For an in-depth analysis of features and price, visit our Blazor chart controls comparison.


Tel: (888) 850 9911
Fax: +1 770 250 6199


