


Official Supplier
As official and authorized distributors, we supply you with legitimate licenses directly from 200+ software publishers.
See all our Brands.
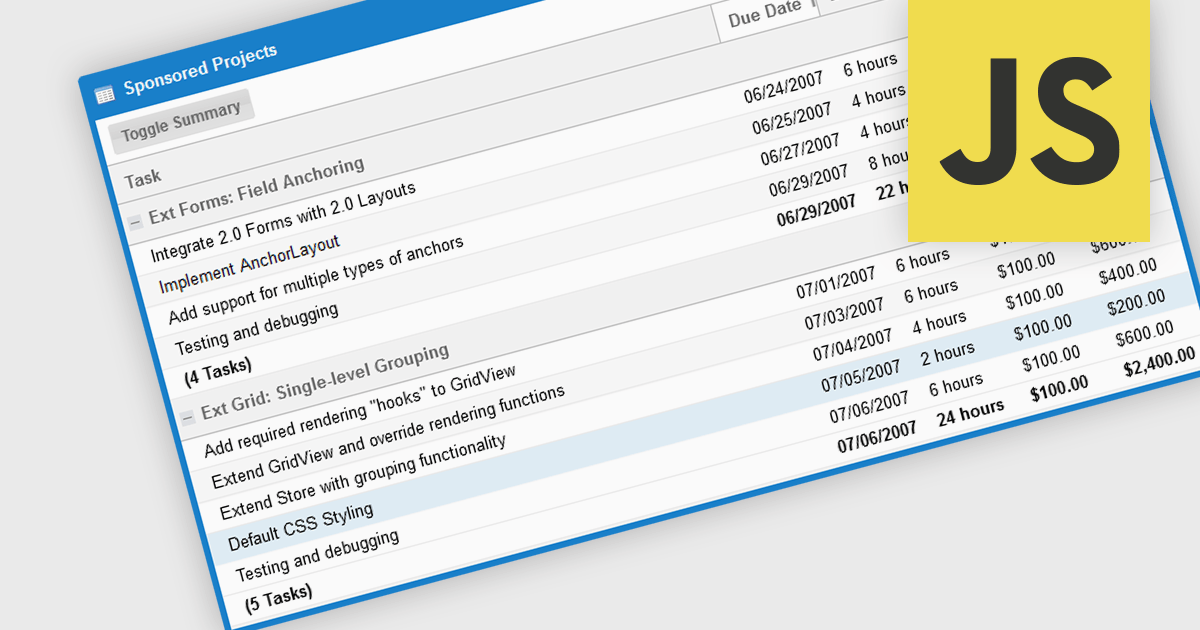
The grouping/summary feature in grid controls enables users to categorize and analyze data effectively by grouping rows based on specific criteria. This functionality allows for the aggregation of data within each group, providing valuable summaries such as totals, averages, counts, and more. By organizing information in a more structured manner, users can gain deeper insights into trends, patterns, and outliers within their data. This feature is particularly useful for large datasets, financial reporting, and data analysis tasks that require a high level of customization and flexibility.
Several JavaScript Grid controls offer grouping / summary support including:
For an in-depth analysis of features and price, visit our comparison of JavaScript grid controls.


Tel: (888) 850 9911
Fax: +1 770 250 6199


