


Official Supplier
As official and authorized distributors, we supply you with legitimate licenses directly from 200+ software publishers.
See all our Brands.
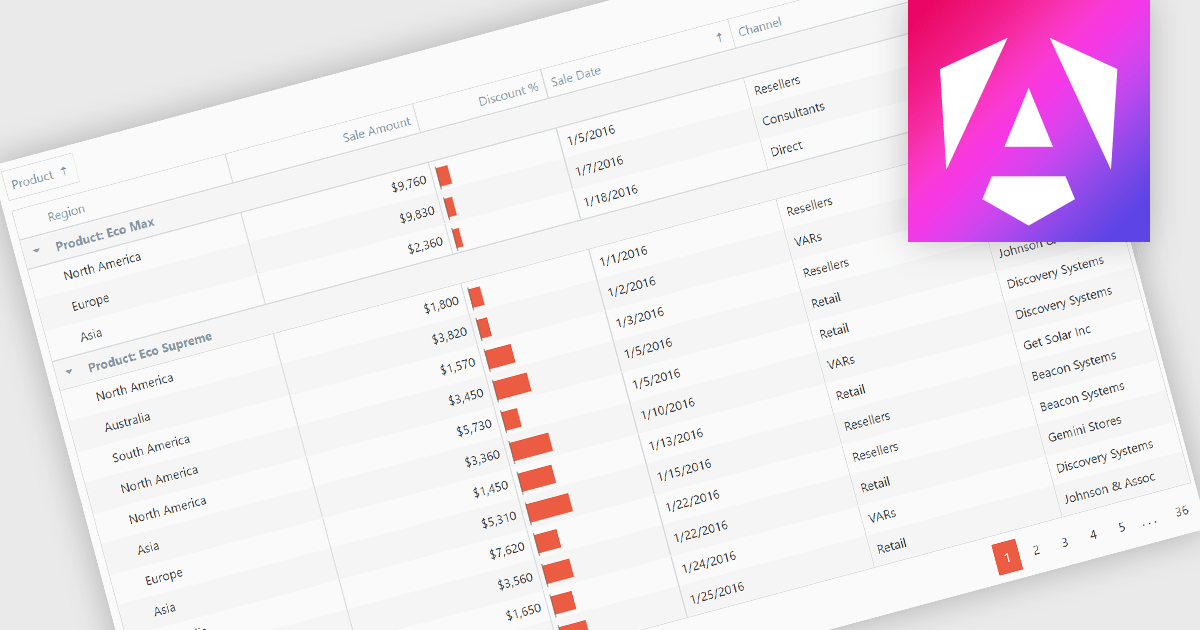
Grouping grid data organizes the data into distinct groups within a grid-like structure. It involves visually clustering related data points together, often using color, shading, or borders, to enhance pattern recognition and make complex datasets more understandable. This method is useful for identifying trends, outliers, and correlations within large amounts of information.
Several Angular grid controls offer support for grouping including:
For an in-depth analysis of features and price, visit our Angular grid controls comparison.


Tel: (888) 850 9911
Fax: +1 770 250 6199


