


Official Supplier
As official and authorized distributors, we supply you with legitimate licenses directly from 200+ software publishers.
See all our Brands.
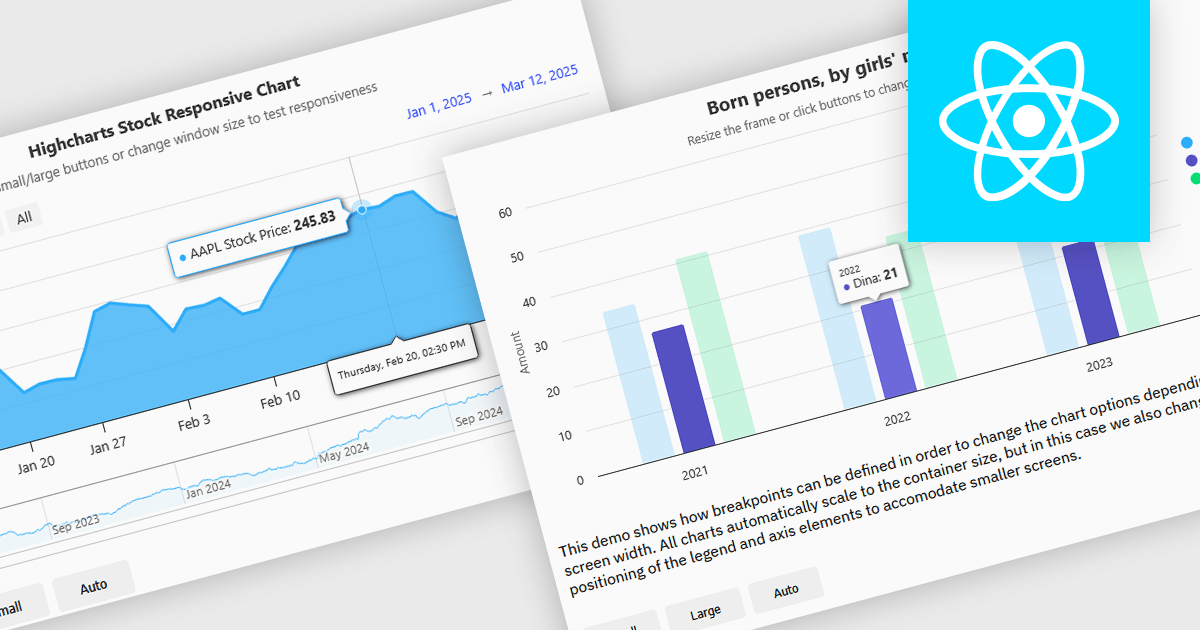
Responsive charts are dynamic data visualizations that automatically adjust to different screen sizes, resolutions, and devices, ensuring a seamless user experience across desktops, tablets, and mobile phones. By adapting elements such as labels, tooltips, legends, and axes, they enhance readability, improve accessibility, and maintain consistent data presentation. These charts optimize performance by efficiently rendering content and supporting interactive features like zooming, panning, and touch gestures. Developers use responsive charts in a wide range of applications, including financial reports, business intelligence dashboards, real-time monitoring systems, and interactive analytics tools, providing users with clear and accessible insights regardless of their device.
Several React charts offer responsive chart support, including:
For an in-depth analysis of features and price, visit our React chart comparison.


Tel: (888) 850 9911
Fax: +1 770 250 6199


