


Official Supplier
As official and authorized distributors, we supply you with legitimate licenses directly from 200+ software publishers.
See all our Brands.
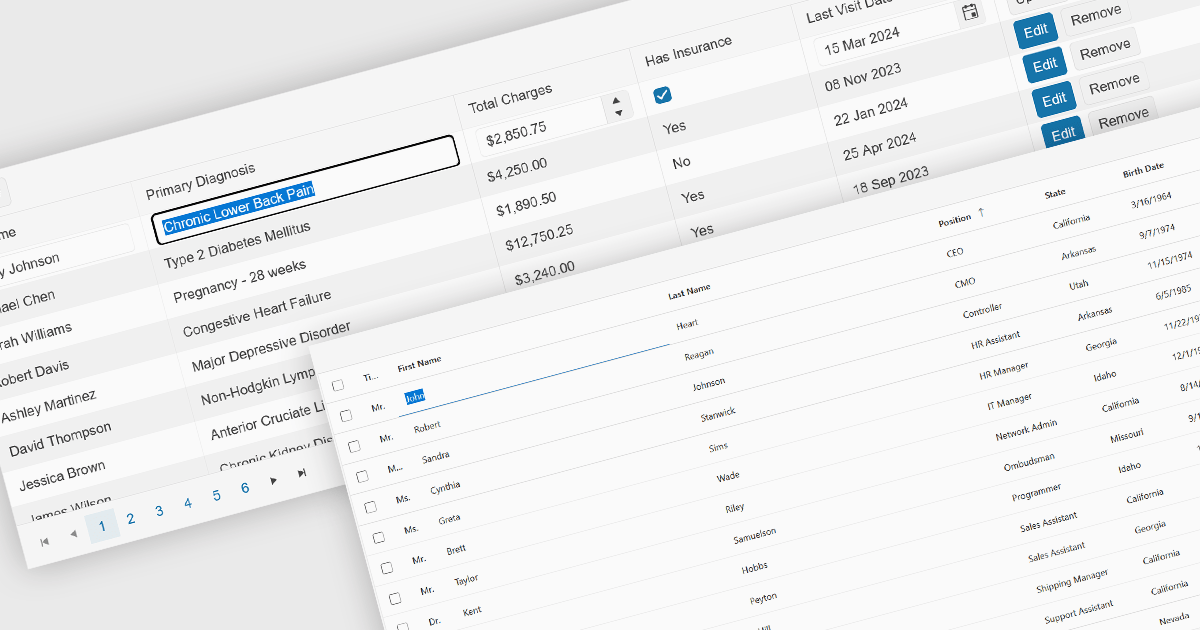
Inline editing is an essential feature of modern grid components, allowing users to create, update, and validate data directly within tabular views. By enabling edits in place, without navigating away from the grid, these features support faster data entry and improve usability in data-intensive applications such as administration panels, financial systems and line-of-business tools.
Several Angular grid controls offer inline editing features, including:
For an in-depth analysis of features and price, visit our Angular grid controls comparison.
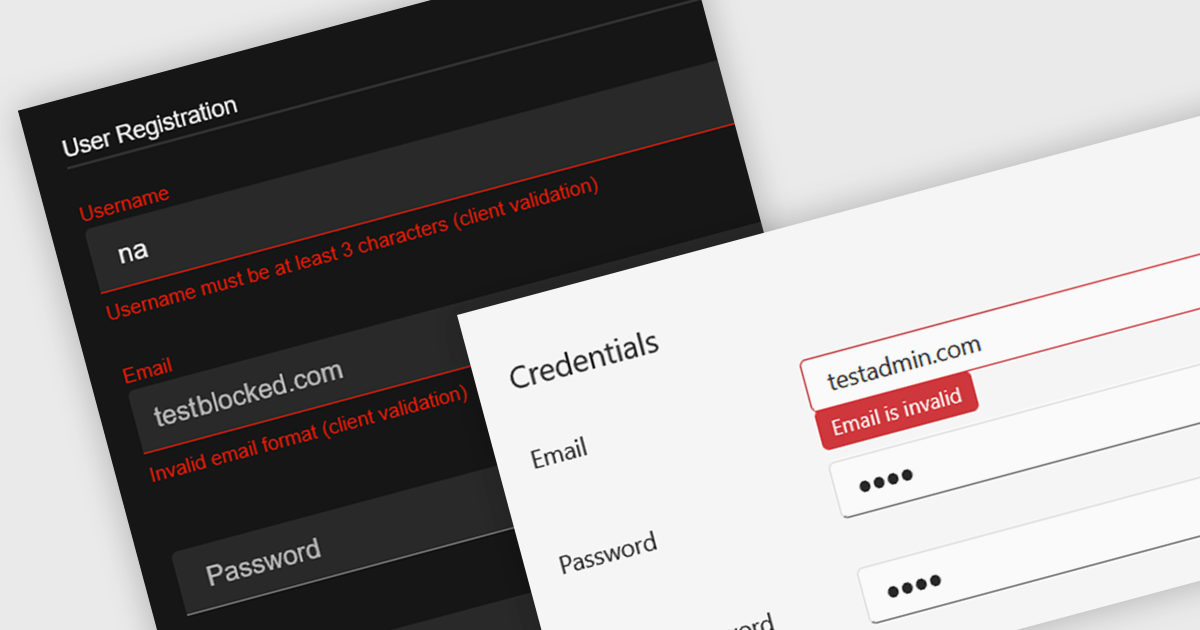
Data validation in a data editor component refers to the process of automatically checking user input against defined rules to ensure accuracy, consistency, and adherence to expected formats before the data is processed or stored. This can include checks for data types, required fields, value ranges, or pattern matching, typically enforced either on the client side for immediate feedback or on the server side for security and integrity. For software developers, incorporating data validation into a data editor improves data quality, reduces the risk of application errors, and enhances the user experience by guiding users to correct mistakes early in the input process.
Several React data editor collections provide support data validation, including:
For an in-depth analysis of features and price, visit our comparison of React data editors.
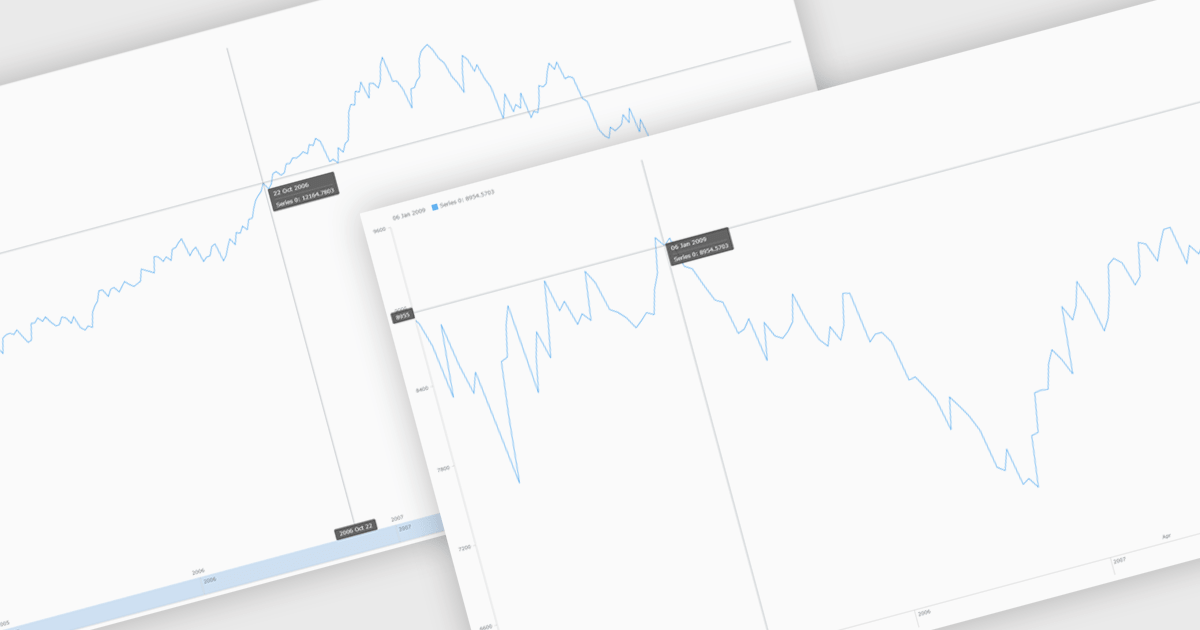
Chart zooming allows users to interactively adjust the visible range of a chart to focus on specific data points, time periods, or value ranges for closer analysis. By enabling users to zoom in and out dynamically, it reduces visual clutter, improves clarity, and helps uncover trends, anomalies, or patterns that may be difficult to identify at a full-scale view. This interactive capability supports faster, more informed decision-making by allowing movement between high-level overviews and detailed insights without reloading data. Common use cases include analyzing financial performance over specific timeframes, investigating spikes or drops in operational metrics, reviewing detailed sensor or monitoring data, and highlighting key data segments during presentations or stakeholder reviews.
Several JavaScript chart controls support zooming including:
For an in-depth analysis of features and price, visit our comparison of JavaScript Charts.
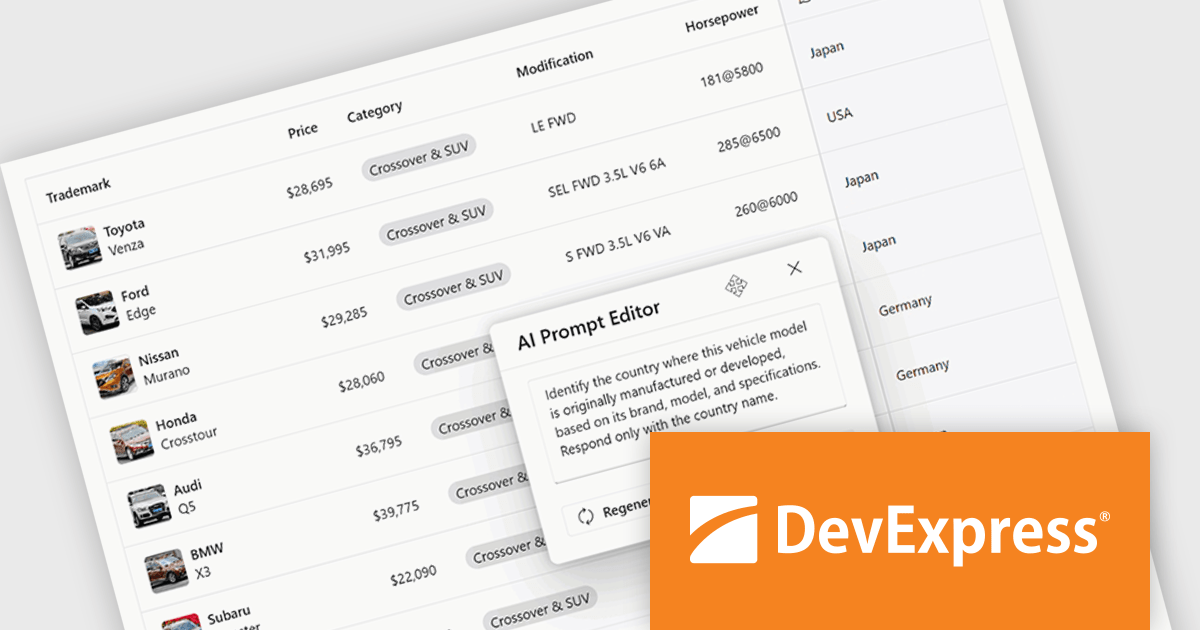
DevExtreme Complete is a robust suite of tools by DevExpress designed to streamline the development of high-performance web applications. It includes a wide range of UI components for modern frameworks such as Angular, React, Vue, and jQuery, making it ideal for developers aiming to create responsive, cross-platform applications with ease. With features like rich data visualization, interactive grids, form controls, and adaptive layouts, it empowers developers to deliver polished and user-friendly interfaces. Whether you're building enterprise dashboards or consumer-facing apps, DevExtreme Complete provides the flexibility and power to meet complex requirements while maintaining performance and usability.
The DevExtreme Complete 25.2 release brings AI Columns to its DataGrid and TreeList components, allowing developers to infuse artificial intelligence directly into their data presentation layers. AI Columns use component data and custom prompts to generate contextually relevant values - automating tasks like categorization, summarization, translation, and recommendation. Whether grouping records by priority, detecting sentiment, or transforming addresses, this feature opens up new ways to interact with and analyze structured data, making these components powerful tools for AI-assisted data exploration.
To see a full list of what's new in version 25.2, see our release notes.
DevExtreme Complete is licensed per developer and is available as a Perpetual License with a 12 month support and maintenance subscription. See our DevExtreme Complete licensing page for full details.
DevExtreme Complete is available to buy individually or as part of the following products:
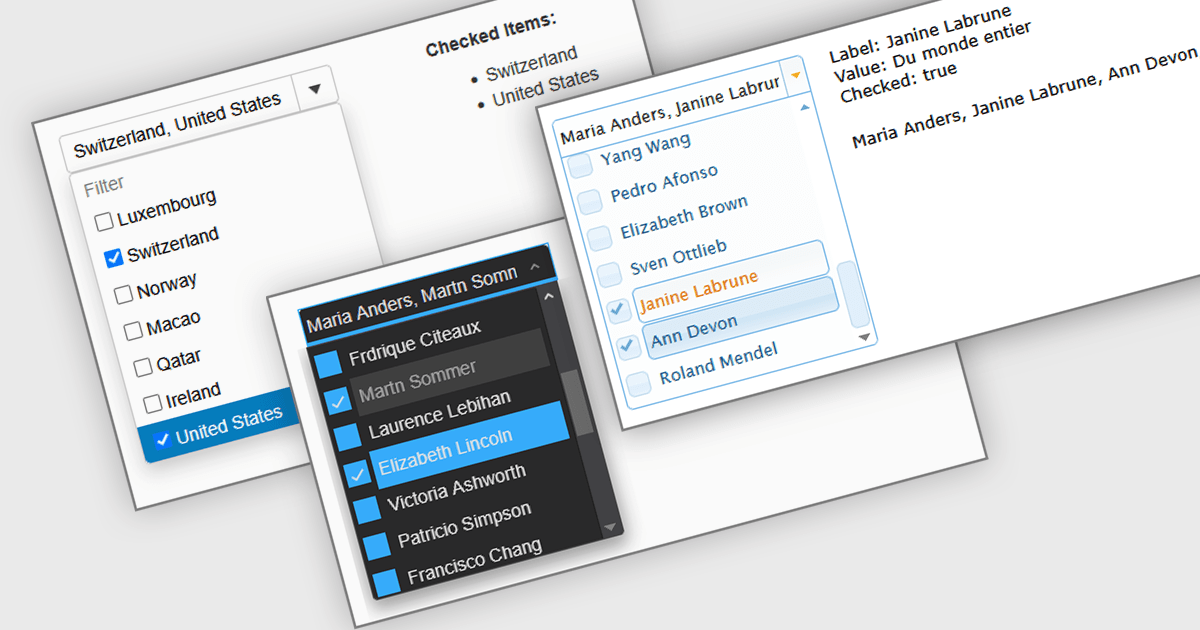
A Checked Combobox in a JavaScript Data Editor is a user interface component that allows users to select multiple options from a dropdown list using checkboxes. It combines the compact form of a combobox with the functionality of a multi-select control, helping to conserve screen space while enabling clear, granular input. This component simplifies data entry and editing workflows, particularly when working with datasets that require multiple discrete values to be associated with a single field. For developers, it offers a way to manage complex form inputs more efficiently, improving both usability and data integrity in cross-platform data management applications.
Several JavaScript data editors offer checked combobox functionality including:
For an in-depth analysis of features and price, visit our comparison of JavaScript data editors.


Tel: (888) 850 9911
Fax: +1 770 250 6199


