


Official Supplier
As official and authorized distributors, we supply you with legitimate licenses directly from 200+ software publishers.
See all our Brands.
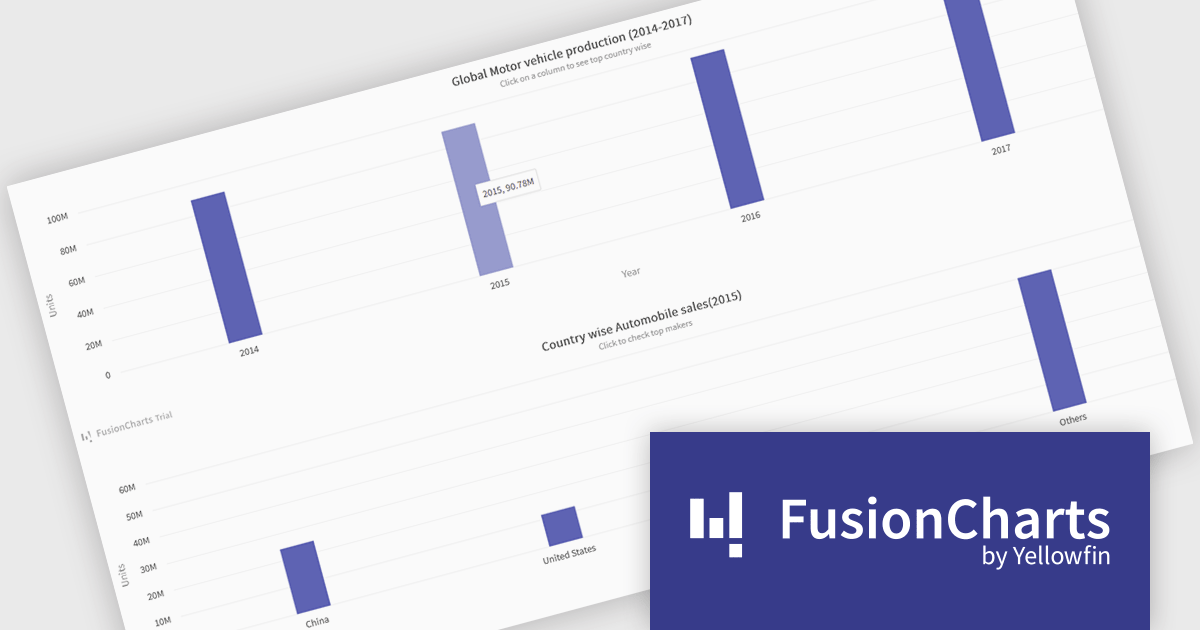
FusionCharts Suite XT is a collection of charting and mapping tools that helps developers create interactive and data-driven dashboards for their web and mobile applications. It provides a wide range of features, including over 100 chart types, data-driven maps, and a variety of customization options. FusionCharts Suite XT helps you visualize and present data in a clear and engaging way.
FusionCharts Suite XT allows developers to implement drill down charts that let users click individual data points to view related charts with more detailed information. This functionality helps developers present large or complex datasets in a structured way, allowing applications to display high level summaries while providing access to deeper data when required. By supporting multiple levels of drill down across most chart types, it supports scalable and interactive data exploration without overloading the initial visualization.
FusionCharts Suite XT is licensed through tiered plans, including Basic, Pro, Enterprise, and Enterprise+, available as annual or perpetual licenses for different developer and deployment needs. See our FusionCharts Suite XT licensing page for full details.
For more information, visit our FusionCharts Suite product page.
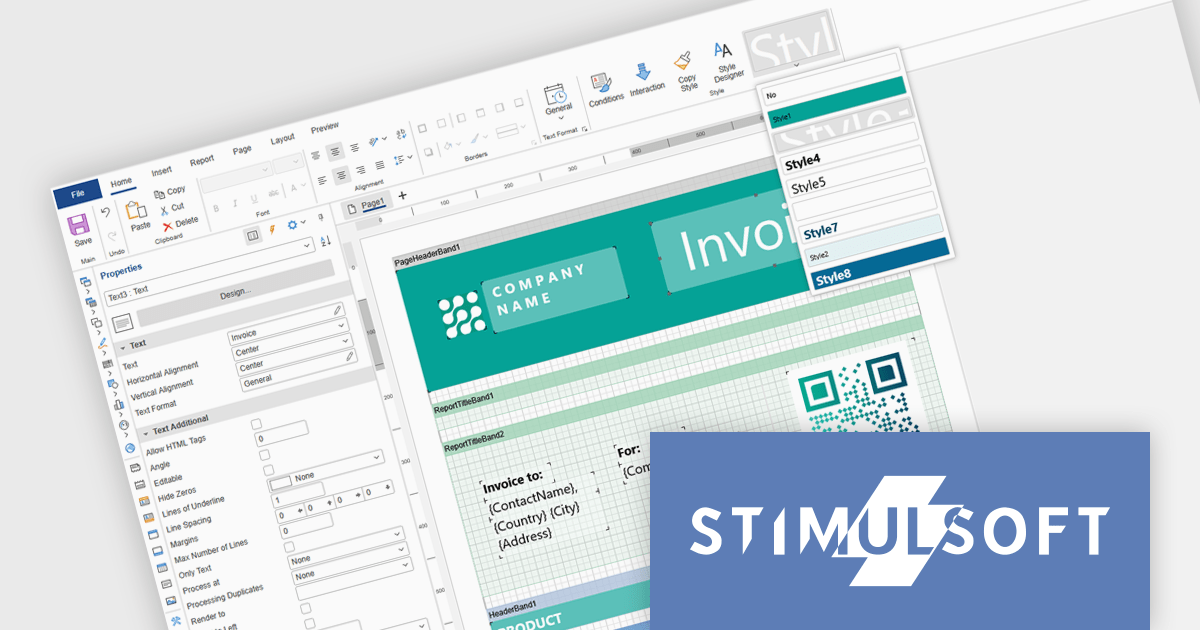
Stimulsoft Ultimate is a reporting and dashboard solution that provides a set of tools for building interactive reports and data visualizations across platforms, including WinForms, ASP.NET, .NET Core, Blazor, JavaScript, WPF, PHP, Java, and Avalonia. It enables developers and organizations to design, generate, and deploy professional reports and dashboards using visual designers, flexible styling options, rich charting and data visualization components, and extensive data connectivity. With support for multiple development environments and technologies, Stimulsoft Ultimate helps teams improve report creation, maintain consistent designs, and deliver clear, data-driven insights for business intelligence, analytics, operational reporting, and enterprise applications.
Stimulsoft Ultimate enables developers to apply centralized report styling that ensures consistent formatting across report elements while reducing the time required to design and maintain reports. By using reusable styles for fonts, colors, borders, and other visual properties, developers can standardize report layouts, quickly apply formatting to multiple components, and implement global design changes without editing each element individually. This approach improves development efficiency, simplifies maintenance, and helps teams deliver professional, visually consistent reports across applications and platforms.
Stimulsoft Ultimate is licensed per developer with Single, Team, Enterprise, and WorldWide options that support one to unlimited developers within an organization. Licenses include a 12 month subscription with updates, priority technical support, a royalty free runtime report designer and viewer, and a build server license for Team and higher tiers. See our Stimulsoft Ultimate licensing page for full details.
For more information, visit our Stimulsoft Ultimate product page.
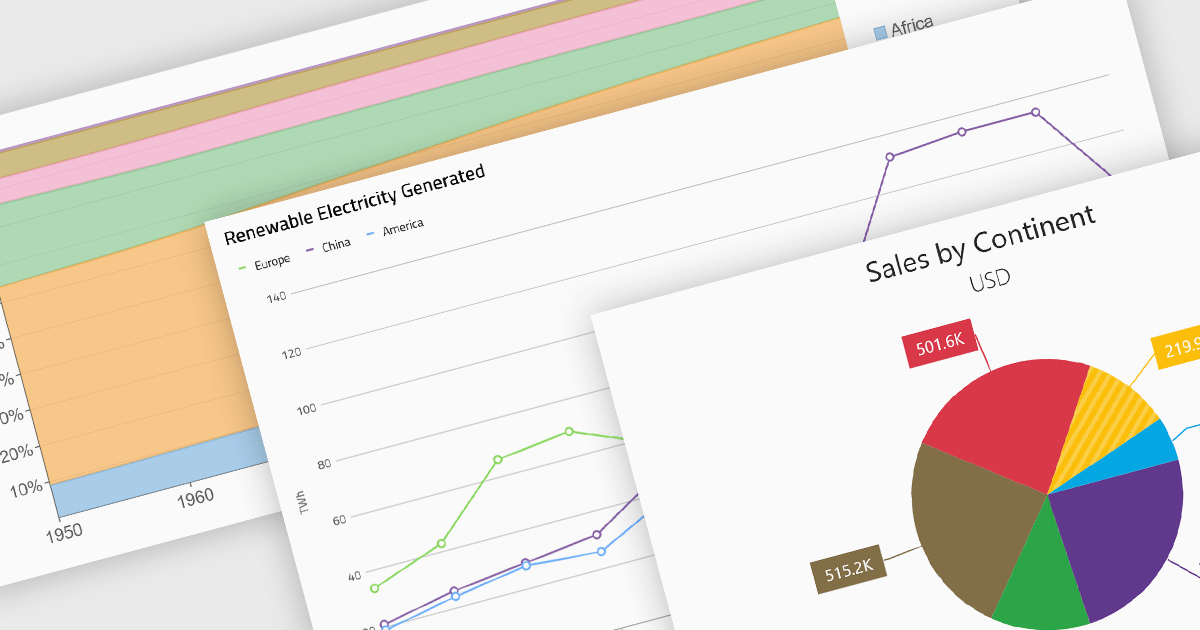
Standard chart types form the foundation of most charting components, providing widely recognized visual formats for representing numerical and categorical data. These charts help developers present trends, comparisons, distributions, and relationships in ways that are immediately understandable to end users. Because these visualizations are familiar across industries, they are commonly included as built-in options in charting libraries and dashboards, allowing applications to communicate insights clearly while supporting interactive features such as tooltips, legends, and dynamic data updates.
Common chart types include:
For an in-depth analysis of features and price, visit our Blazor charts components comparison.
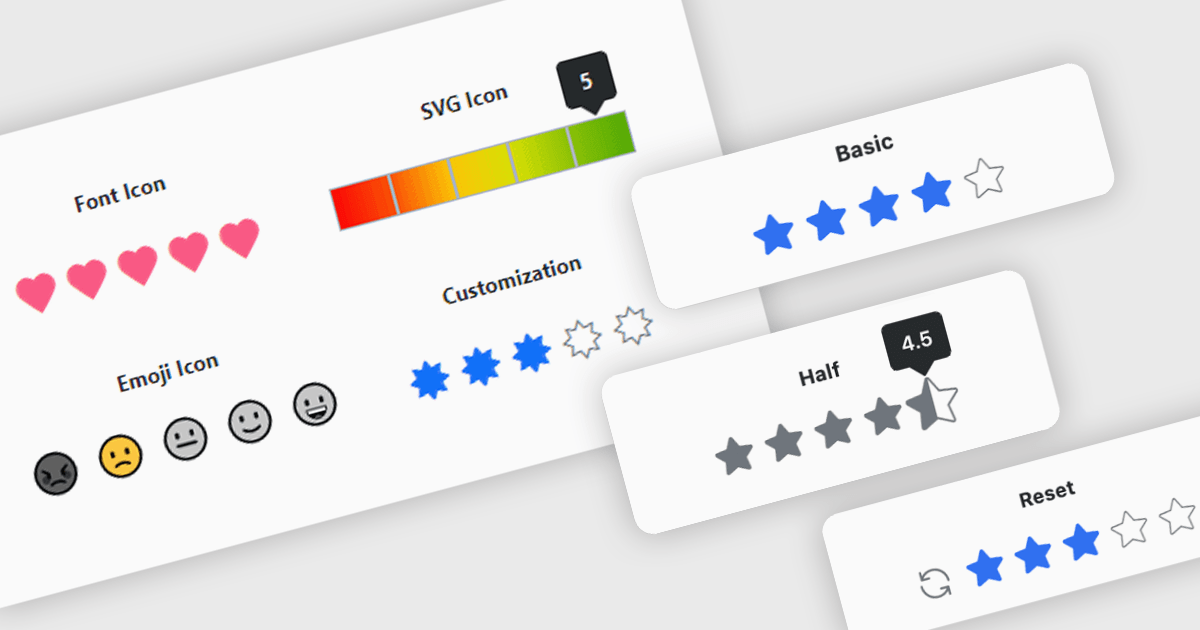
A rating feature in a data editor allows users to assign a value, typically through icon based controls such as stars or similar symbols, directly within a grid or form to evaluate related content. By transforming subjective opinions into structured, quantifiable data, rating components make feedback easy to capture, analyze, and display. This enhances user engagement and supports more informed decision making based on aggregated insights. Common use cases include rating products in ecommerce dashboards, evaluating service performance in internal business systems, scoring support tickets by priority or satisfaction, and assessing content quality within content management platforms.
Several Blazor data editor collections provide rating controls including:
For an in-depth analysis of features and price, visit our Blazor Data Editors comparison.

DevExpress and ComponentSource have worked together for 25 years, building a long-standing partnership focused on providing professional developer tools. DevExpress is known for its extensive range of UI controls, reporting tools, dashboards, and application frameworks across platforms including .NET, JavaScript, Blazor, WinForms, WPF, and ASP.NET. Together, the two companies support development teams creating desktop, web, and mobile applications.
At the center of this collaboration is DevExpress Universal, a flagship product available through ComponentSource, giving developers access to the full suite of DevExpress UI controls, reporting, and testing tools in a single subscription. This comprehensive offering helps teams standardize on one vendor while covering multiple platforms and project requirements.
This long-term partnership strengthens ComponentSource’s product portfolio by including one of the most widely used developer toolsets in the industry. It also enables ComponentSource to deliver DevExpress products to customers worldwide, supported by international sales teams, local currencies, and licensing expertise that simplify the purchasing process for organizations across different regions.
Learn more about DevExpress.


Tel: (888) 850 9911
Fax: +1 770 250 6199


