








Official Supplier
As official and authorized distributors, we supply you with legitimate licenses directly from 200+ software publishers.
See all our Brands.

Line annotations are digital markings that allow users to draw straight lines on documents. These lines can be used for various purposes, such as connecting related information, highlighting specific sections, or adding visual cues for reference. They are particularly useful for tasks that require comparison, measurement, or the creation of diagrams or flowcharts directly within the PDF.
Several React PDF viewer controls offer support for line annotations including:
For an in-depth analysis of features and price, visit our React PDF viewer controls comparison.

ActiveReportsJS by MESCIUS is a JavaScript reporting toolkit that empowers developers to design and embed interactive reports within web applications. It offers a standalone report designer for crafting reports and a JavaScript report viewer component for seamless integration into web frameworks like React or vanilla JavaScript. This solution streamlines report creation, facilitates data visualization, and delivers a user-friendly report experience.
The ActiveReportsJS 5.1 update introduces a Master Report feature, which improves report design efficiency by allowing developers to create reusable templates that define common elements such as headers, footers, and styles. Multiple reports can inherit shared components, reducing redundancy and simplifying maintenance. Developers can ensure consistency across reports and make global updates more efficiently, making it easier to scale for larger applications. Using a master report template is valuable in dynamic web applications, where maintaining uniform reporting structures is crucial for delivering a cohesive user experience.
To see a full list of what's new in 5.1, see our release notes.
ActiveReportsJS is licensed on an annual subscription or perpetual basis and is available as a Single Deployment License for non-commercial use, and as a Single Domain License or Unlimited Domain License for commercial and/or SaaS use. See our ActiveReportsJS licensing page for full details.
Learn more on our ActiveReportsJS product page.

Stimulsoft Dashboards.JS is a JavaScript library designed for building interactive dashboards within web applications. It offers a comprehensive suite of tools for data processing, visualization, and dashboard design. Compatible with any HTML5 browser, it allows you to create a variety of dashboards for various purposes and integrates seamlessly with popular JavaScript frameworks like React and Vue.js.
The Stimulsoft Dashboards.JS 2024.4.1 release introduces new white and black dashboard style along with a new preset style for report components which offers a modern, sleek aesthetic with improved readability, making key data more distinguishable and reducing eye strain. This design ensures consistency across reports, enhances brand cohesion, and provides a professional, visually engaging experience. With easy application and customizable elements, users can quickly adapt their dashboards to suit their needs, while maintaining a uniform look. Optimized for both desktop and mobile, this new style streamlines the creation of visually appealing, user-friendly reports.
To see a full list of what's new in 2024.4.1, see our release notes.
Stimulsoft Dashboards.JS is licensed per developer and is available as a Perpetual license with 1 year support and maintenance. See our Stimulsoft Dashboards.JS licensing page for full details.
Stimulsoft Dashboards.JS is available in the following products:
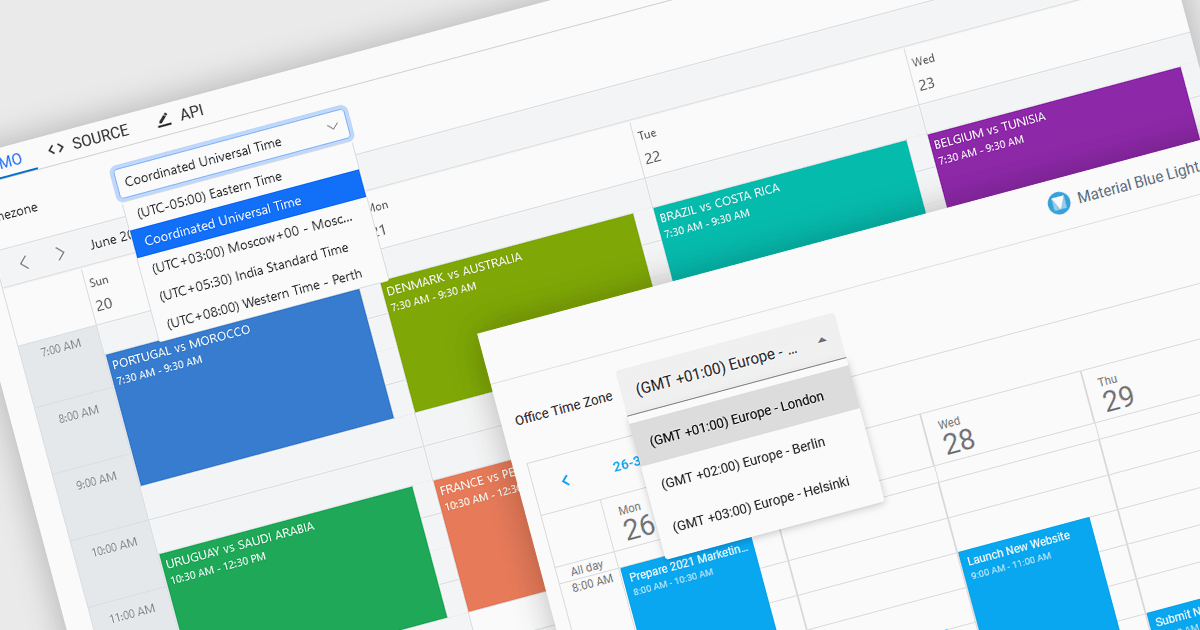
Time zone support in a scheduling component enables users to create, view, and manage events across different regions without manual time conversion. It automatically adjusts appointments based on the user’s local time zone and accounts for daylight saving time (DST) changes, ensuring accurate scheduling. This feature is particularly beneficial for global teams, remote workers, and businesses coordinating across multiple time zones. For example, an international company can schedule a meeting for participants in New York, London, and Tokyo, and each attendee will see the event in their local time. Time zone support eliminates confusion, reduces scheduling errors, and improves efficiency in cross-border collaboration.
Several JavaScript products offer scheduling components with time zone support including:
Explore our range of JavaScript scheduling components.
Need help to find the right software license, upgrade or renewal? Call, Email, or Live Chat with our experts.
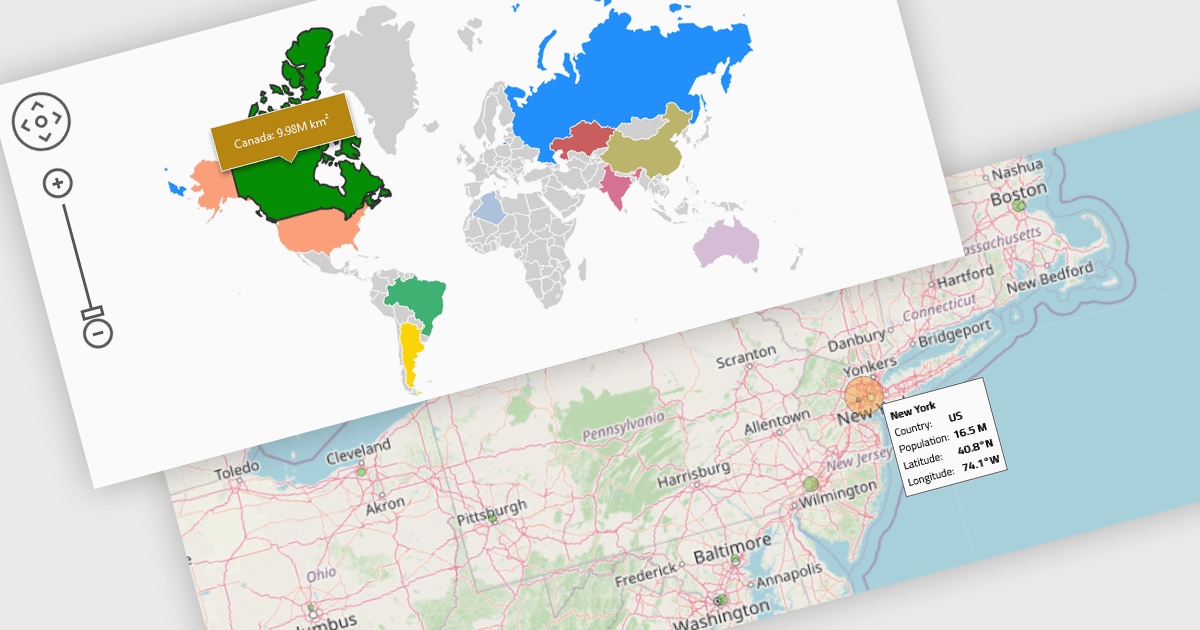
Map components enable the integration of dynamic maps within applications, often enabling features such as zooming, markers, and layers. These maps enhance user experience by displaying geospatial data in real time and across devices. Benefits include responsiveness and high performance, with common use cases such as tracking deliveries, visualizing demographic data, or displaying store locations interactively.
Several React UI suites provide map controls including:
For an in-depth analysis of features and price, visit our React chart controls comparison.





Tel: (888) 850 9911
Fax: +1 770 250 6199


