








Official Supplier
As official and authorized distributors, we supply you with legitimate licenses directly from 200+ software publishers.
See all our Brands.
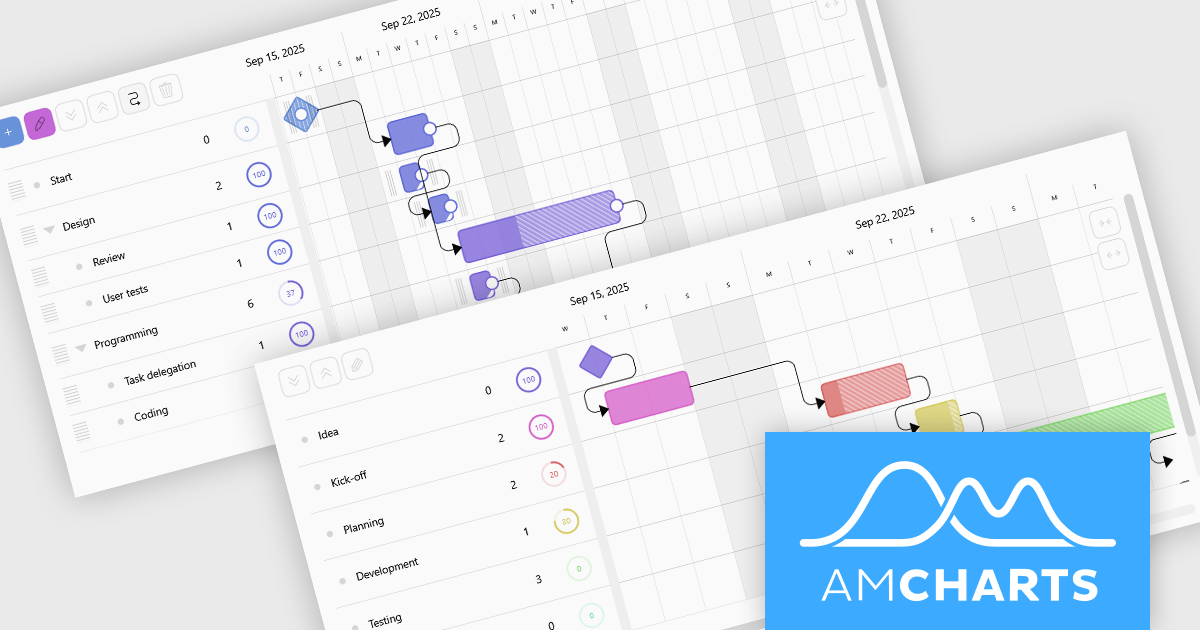
amCharts 5: Gantt is a dedicated JavaScript and TypeScript component for building rich, interactive Gantt charts directly in web applications and dashboards. It is built on the modern amCharts 5 engine and provides everything developers need to visualize project schedules, timelines, and task dependencies using responsive, fast rendering HTML5 graphics. The component supports hierarchical task structures, category grouping, and flexible time scales, which makes it suitable for representing complex projects in a clear, compact, and professional format. With a robust API and straightforward integration in common front end stacks, amCharts 5: Gantt fits naturally into modern web architectures.
amCharts 5: Gantt offers a wide range of capabilities that help teams understand and manage work more effectively, including visual progress indicators, task linking with dependencies, support for milestones and events, and interactive markers for important dates. Charts can be configured as read only monitoring views or as fully interactive planning surfaces where users can drag tasks, adjust timings, update completion, and explore details through tooltips and selection. These strengths make the product an excellent choice for project management systems, resource and workload dashboards, product roadmaps, and visualization tools, wherever organizations need a clear and engaging way to communicate what is happening, what comes next, and how work is progressing.
amCharts 5: Gantt is licensed per developer on an annual or perpetual basis, with options for websites, SaaS and OEM distribution. See our amCharts 5: Gantt licensing page for full details.
For more information, visit our amCharts 5: Gantt product page.
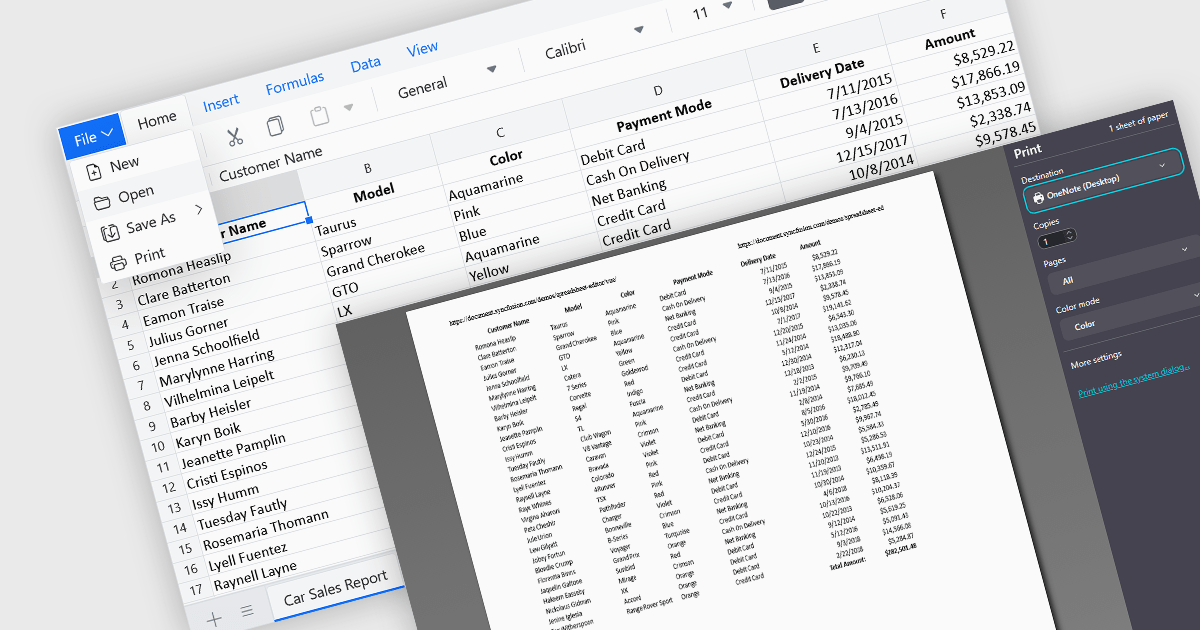
The ability to print spreadsheets is a core feature that produces a physical copy or a formatted digital version, such as a PDF, of the data and layout contained within a spreadsheet file. This function allows users to review, distribute, archive, or present the original information that preserves the structure in a readable and consistent format. By configuring print settings, such as page orientation, scaling, and headers, users can control how the content appears on paper, ensuring clarity and professionalism in the output. It is especially useful for reports, financial statements, and records that need to be reviewed offline or submitted in a formal context.
Several Vue.js spreadsheet components enable printing, including:
For an in-depth analysis of features and price, visit our comparison of Vue.js spreadsheet components.
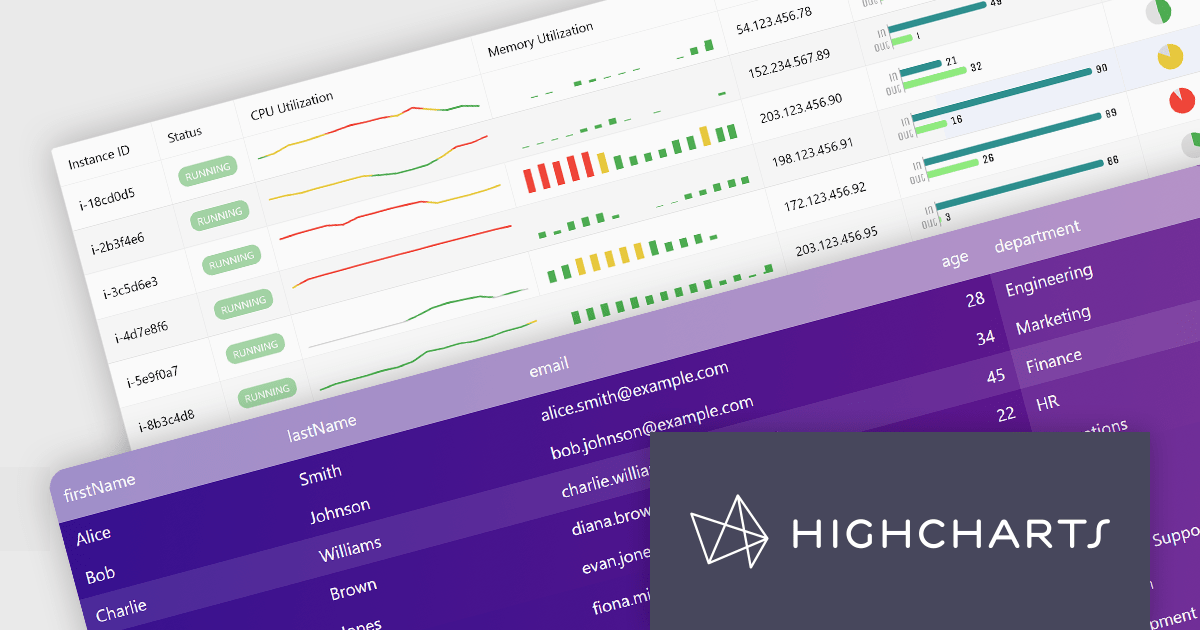
Highcharts Grid Pro is a versatile data grid component developed by the creators of Highcharts, offering both standalone functionality and tight integration within the Highcharts and Highcharts Dashboards ecosystems. It features advanced capabilities such as real-time data binding, column sorting, filtering, inline editing, pagination, and data export, enabling users to work with structured data efficiently. Designed to complement Highcharts' visual components, Grid Pro allows for seamless alignment between data tables and interactive charts when used together, but it can also function independently in applications that require only tabular data interaction. This makes it ideal for a wide range of use cases, including financial platforms, business intelligence tools, and any application where users need to view, edit, and interact with complex datasets directly in the browser.
Highcharts Grid Pro is now available as a standalone component. The v2.0 update delivers a set of professional-grade enhancements focused on improving usability, data control, and visual clarity. It introduces interactive editing with built-in editors for text, numbers, and dates, making in-grid updates more intuitive. Configurable validation rules ensure data accuracy, while embedded sparklines, powered by Highcharts Core, provide immediate visual insights alongside the data. Features such as pagination, column filtering, and sorting make it easier to manage and explore large datasets. Developers can also implement custom behaviors and event hooks to align the grid with specific application needs.
For a limited time you can benefit from special introductory pricing!
Save 50% off new licenses of Highcharts Grid Pro or Highcharts Dashboards when bought individually or when combined in a bundle with other products from Highsoft including Highcharts Core, Stock, Maps and Gantt.
Highcharts Grid Pro is licensed per developer as an Annual or Perpetual License with Internal, Saas, SaaS+ and OEM distribution options. The annual license includes support and all product updates for 1 year and must be renewed to continue to use the software. The perpetual license includes an "Advantage Subscription" which provides support and updates for a set period of time. If you do not renew Advantage then you may continue to use the software at the last release available during the active Advantage period. See our Highcharts Grid Pro licensing page for full details.
Learn more on our Highcharts Grid Pro product page.
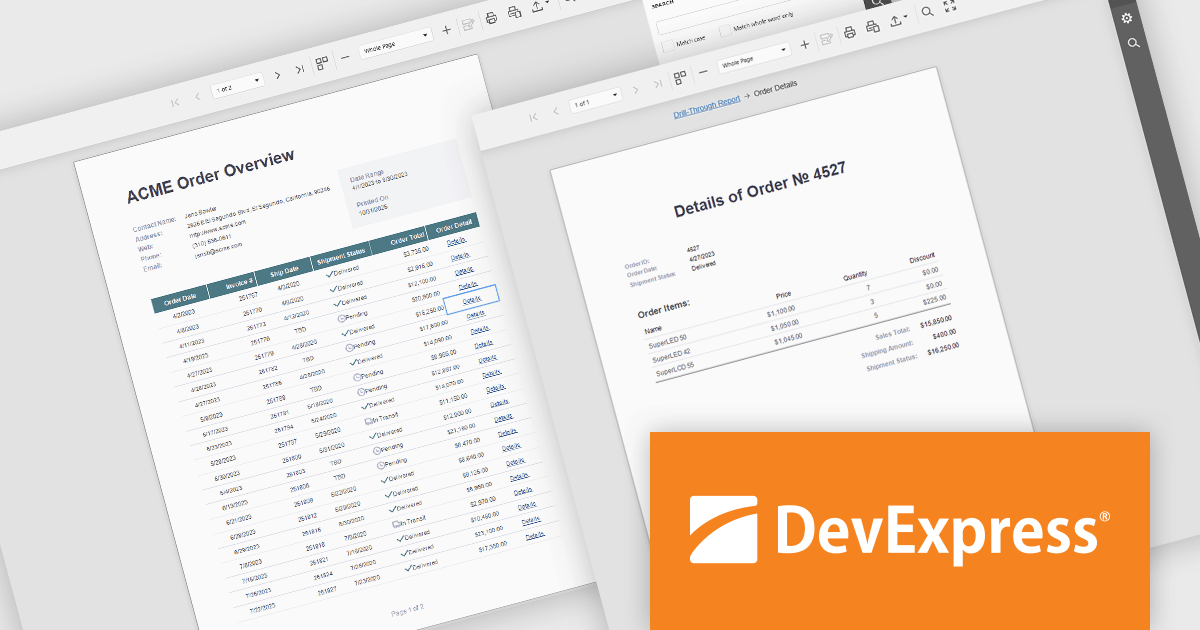
DevExpress Reporting is a comprehensive suite of reporting tools that help developers create visually stunning and highly customizable reports for various applications. With its rich feature set, including data binding, layout design, printing, and exporting capabilities, DevExpress Reporting enables the efficient creation of reports that meet the most demanding business requirements.
DevExpress Reporting enhances data analysis by enabling drill-through reports, allowing developers to create interactive report designs that link summary-level data to detailed information. This feature provides a streamlined way for users to explore data hierarchies without leaving the main report, improving usability and workflow efficiency. By clicking on data points, users can view related details in a connected report, ensuring a cohesive and intuitive data exploration experience. This capability helps developers deliver more dynamic, context-rich reporting solutions that support faster and more informed decision-making.
DevExpress Reporting is licensed per developer and is available as a Perpetual License with a 12 month support and maintenance subscription. See our DevExpress Reporting licensing page for full details.
DevExpress Reporting is available to buy in the following products:
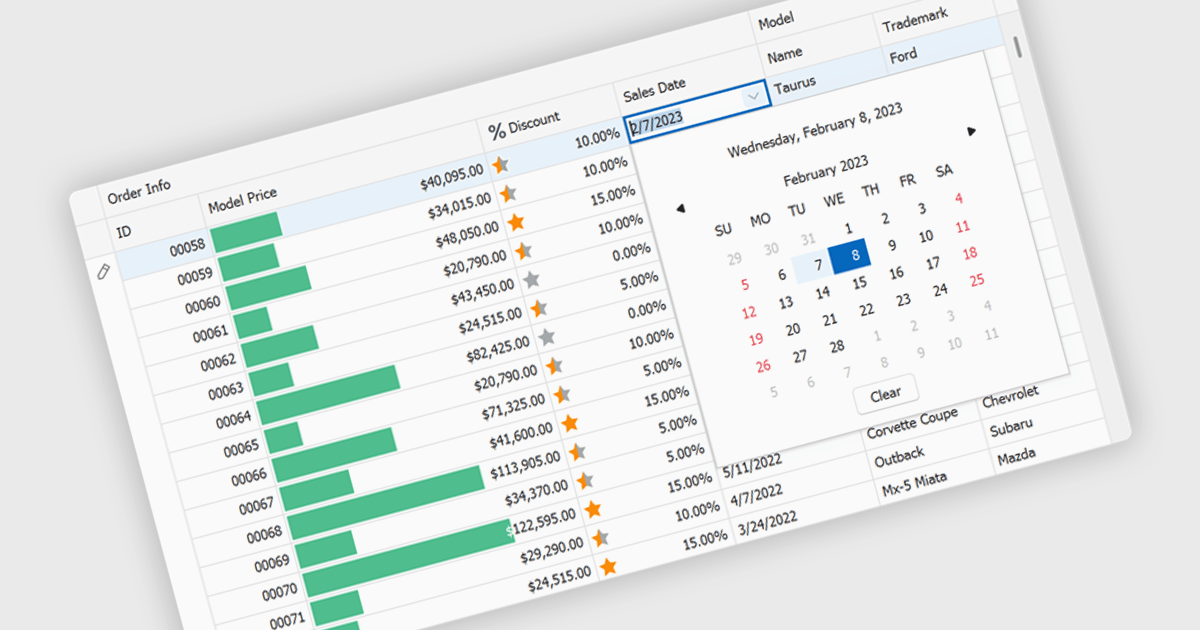
A date editor enables users to easily input, modify, and validate date values through an intuitive interface such as a calendar picker or spinner. This feature ensures consistent date formats across datasets, reduces manual entry errors, and improves overall data integrity. By enforcing validation rules and supporting localization, date editors accommodate a wide range of user needs and regional formats. Common use cases include managing records in applications such as employee databases, scheduling systems, financial reporting tools, and project management dashboards where accurate and consistent date information is essential for reliable data analysis and decision-making.
Several Vue.js data editor collections provide date editors including:
For an in-depth analysis of features and price, visit our Vue.js Data Editors comparison.





Tel: (888) 850 9911
Fax: +1 770 250 6199


