








Official Supplier
As official and authorized distributors, we supply you with legitimate licenses directly from 200+ software publishers.
See all our Brands.
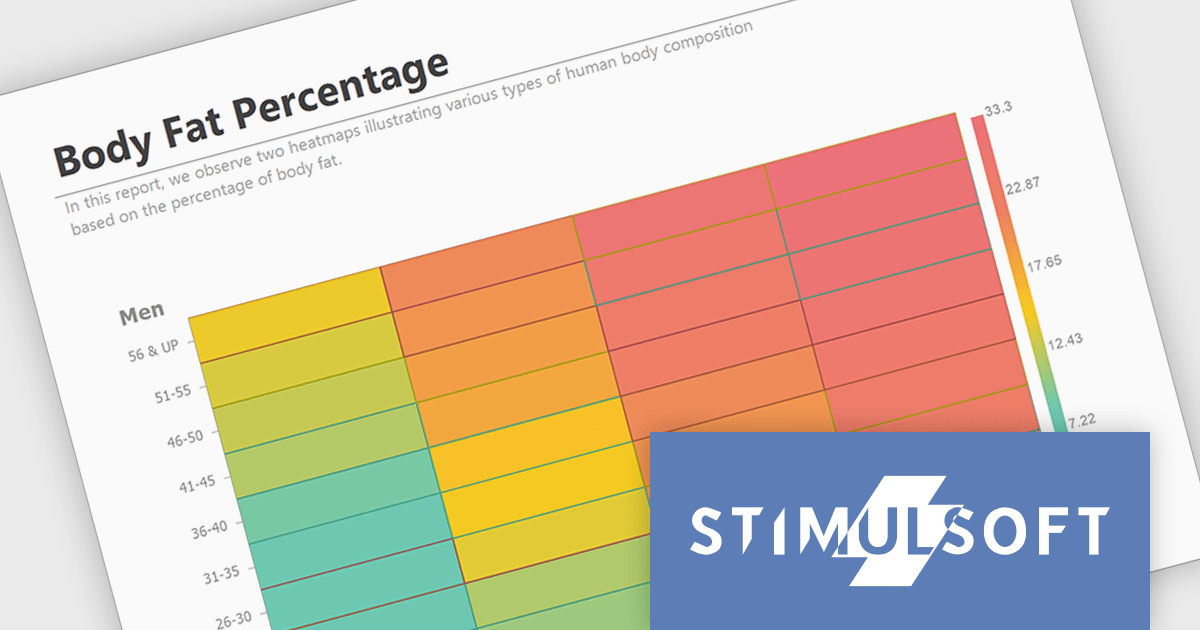
Stimulsoft Reports.JS provides a robust reporting toolkit designed specifically for JavaScript applications. This library leverages a client-side architecture, offering a pure JavaScript report engine for efficient report rendering directly within web browsers. The solution includes a user-friendly report designer for building reports with various data sources and visualizations, along with a report viewer for seamless integration and display within your JavaScript applications. This eliminates the need for server-side dependencies or browser plugins, simplifying the development process for embedding powerful reporting functionalities into your web projects.
The Stimulsoft Reports.JS 2024.3 update adds a powerful new data visualization tool: the heatmap chart. This intuitive chart type excels at revealing patterns and trends within large datasets. By visually encoding data values through color gradients, heatmaps simplify complex information, allowing users to quickly identify areas of high, medium and low concentration. Stimulsoft Reports.JS seamlessly integrates heatmaps into your existing reporting workflows, enhancing data exploration and communication for your users.
To see a full list of what's new in version 2024.3, see our release notes.
Stimulsoft Reports.JS is licensed per developer and is available as a Perpetual license with 1 year support and maintenance. See our Stimulsoft Reports.JS licensing page for full details.
Stimulsoft Reports.JS is available in the following products:

DevExpress BI Dashboard (part of DevExpress Universal) empowers you to craft interactive dashboards for desktop, web and mobile applications. It provides a visual designer for building dashboards without writing code, allowing you to drag-and-drop various data visualization widgets onto the canvas. These widgets connect to your data sources and update dynamically, offering real-time insights to end users. The tool also supports customization through properties and events, enabling you to tailor the look and feel of the dashboards to perfectly integrate with your application's design.
The DevExpress BI Dashboard 24.1 release adds support for cascading parameters. This powerful feature allows you to create intuitive filter hierarchies within your dashboards. Imagine selecting a value in a parent parameter, then watching as the options in a dependent parameter automatically update to reflect the chosen filter. This eliminates the need for users to manually navigate through potentially overwhelming dropdown lists, fostering a more focused and efficient experience. Cascading parameters empower you to design dashboards that guide users towards deeper insights within your data.
To see a full list of what's new in version 24.1, see our release notes.
DevExpress BI Dashboard is included as part of DevExpress Universal which is licensed per developer and is available as a Perpetual License with a 12 month support and maintenance subscription. See our DevExpress Universal licensing page for full details.
DevExpress BI Dashboard is available in the following products:
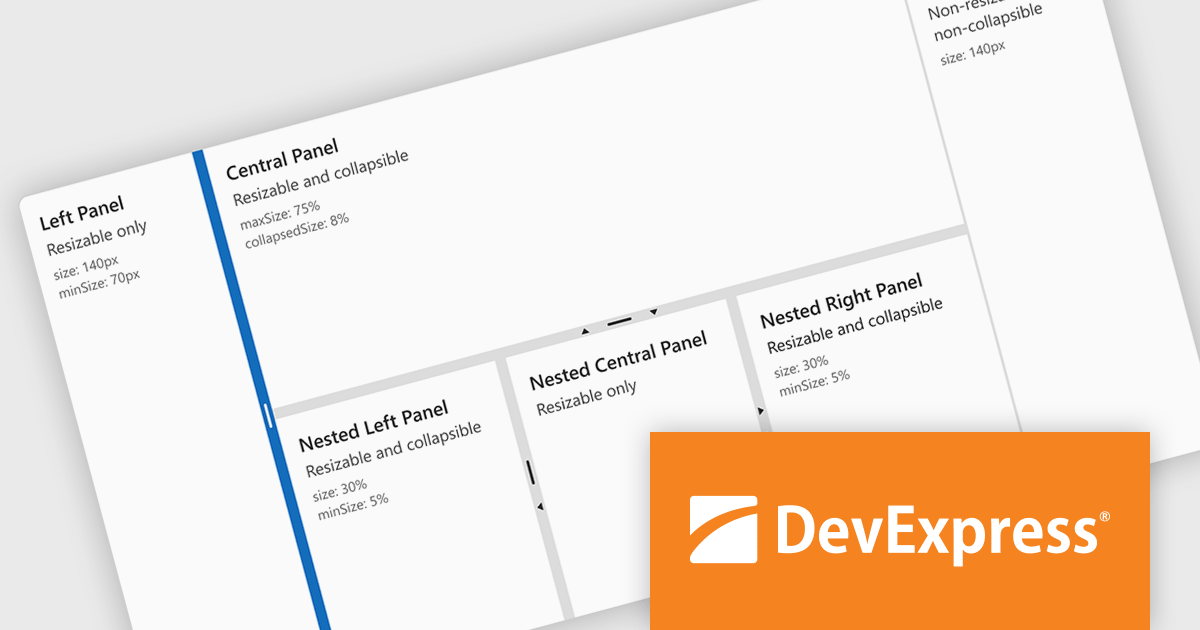
DevExtreme Complete by DevExpress is a collection of high-performance, pre-built UI components designed for web and mobile app development. It offers a rich set of widgets including data grids, charts, editors, and navigation tools that are responsive and work seamlessly across different browsers and devices. DevExtreme Complete allows developers to build feature-rich and user-friendly applications for modern web experiences.
DevExtreme Complete 24.1 adds a new splitter component. This powerful addition allows you to create flexible page layouts with resizable and collapsible panes. Panes can be oriented horizontally or vertically and can contain various content types, including HTML and other DevExtreme components. The splitter offers customization options for handle size, appearance, and keyboard accessibility, making it a powerful tool for building adaptable web applications.
To see a full list of what's new in version 24.1, see our release notes.
DevExtreme Complete is licensed per developer and is available as a Perpetual License with a 12 month support and maintenance subscription. We can supply any DevExtreme Complete license including new subscriptions, subscription renewals, expired subscription renewals, and additional licenses. See our DevExtreme Complete licensing page for full details.
DevExtreme Complete is available to buy in the following products:
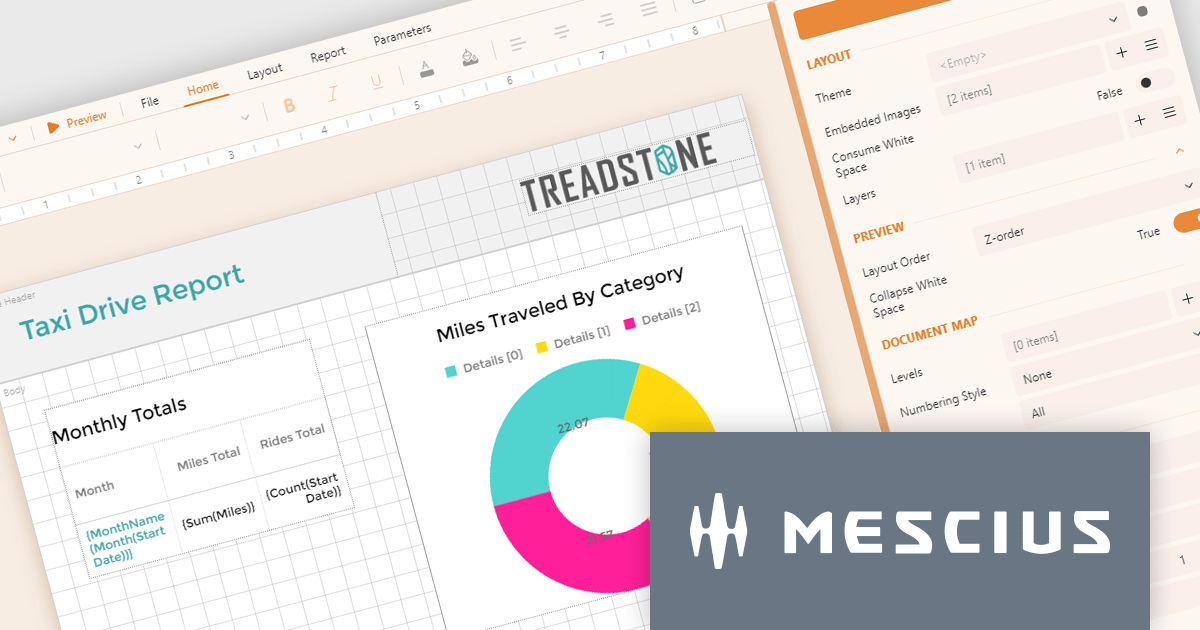
ActiveReportsJS by MESCIUS is a JavaScript reporting toolkit that empowers developers to design and embed interactive reports within web applications. It offers a standalone report designer for crafting reports and a JavaScript report viewer component for seamless integration into web frameworks like React or vanilla JavaScript. This solution streamlines report creation, facilitates data visualization, and delivers a user-friendly report experience.
The ActiveReportsJS 5.0 update modernizes the development experience by refreshing the look and feel of both the Report Designer and Report Viewer components with new icons and colors. This enhances clarity and consistency and improves the design environment. Improved theming capabilities empower you to effortlessly apply pre-defined themes or customize the designer's appearance to match your application's branding, fostering a more cohesive user experience within your web applications.
To see a full list of what's new in 5.0, see our release notes.
ActiveReportsJS is licensed on an annual subscription or perpetual basis and is available as a Single Deployment License for non-commercial use, and as a Single Domain License or Unlimited Domain License for commercial and/or SaaS use. See our ActiveReportsJS licensing page for full details.
Learn more on our ActiveReportsJS product page.
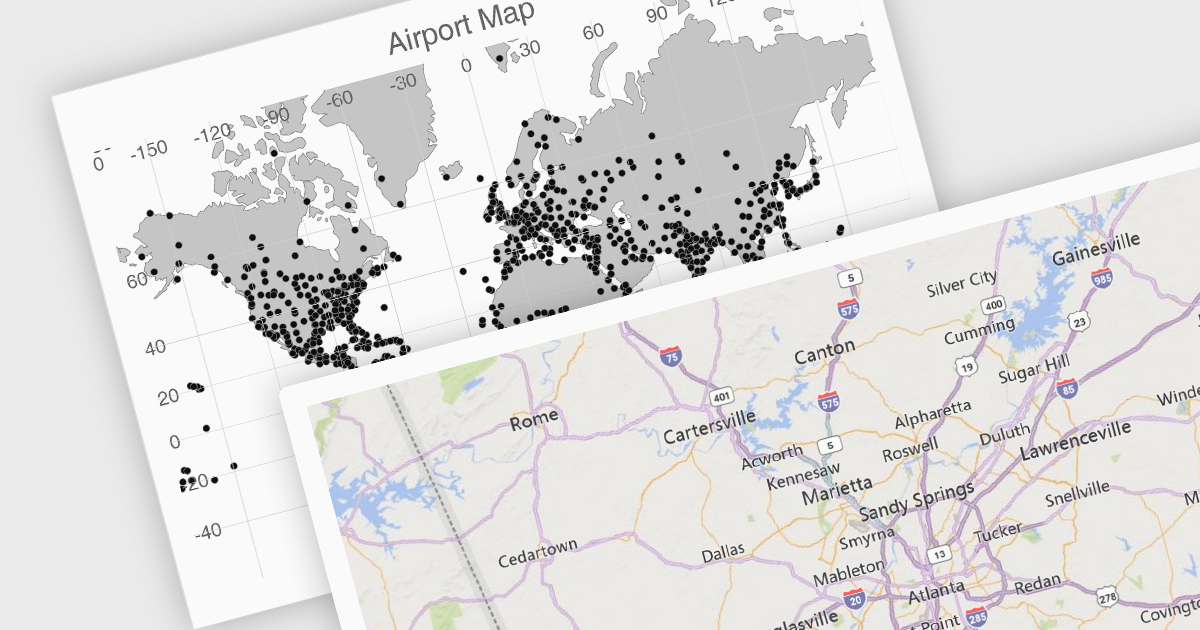
UI suites often include map components that streamline the development process for applications displaying geographical data. These components integrate seamlessly with the chosen framework, offering features like base map selection, zoom controls, and location markers. They can be customized to display real-time data visualizations, allowing users to explore trends and patterns across geographic regions. This functionality is valuable for applications in logistics, e-commerce, and any industry where location plays a key role.
Several Vue.js UI suites offer mapping functionality, including:
For an in-depth analysis of features and price, visit our comparison of Vue.js UI suites.





Tel: (888) 850 9911
Fax: +1 770 250 6199


