








Official Supplier
As official and authorized distributors, we supply you with legitimate licenses directly from 200+ software publishers.
See all our Brands.
Aspose.Drawing for Java is a versatile and robust library designed to streamline the creation, manipulation, and conversion of 2D graphics within Java applications. It caters to both vector and raster graphics, offering developers the ability to programmatically draw lines, shapes, text, and even intricate paths. This feature-rich library boasts cross-platform compatibility, seamlessly integrating with web, mobile, desktop, and cloud environments. Aspose.Drawing for Java also supports a wide range of popular file formats, ensuring flexibility in saving and exporting your graphical creations.
By leveraging Aspose.Drawing for Java, developers can experience a multitude of benefits. The library simplifies complex 2D graphics tasks, saving valuable time and effort while ensuring consistent, high-quality results. Its cross-platform capabilities eliminate compatibility concerns, allowing developers to create graphics that seamlessly adapt across different platforms. Supporting a diverse range of file formats opens doors to various use cases, including data visualization, report generation, image editing, and more.
Aspose.Drawing for Java is offered as Developer Small Business, Developer OEM, Developer SDK, Site Small Business, Site OEM, and Site SDK licenses catering to a range of business needs. Licenses are perpetual, and include 1 year of support and maintenance. Subscription renewals are also available. See our Aspose.Drawing for Java licensing page for full details.
Aspose.Drawing for Java is available in the following products:
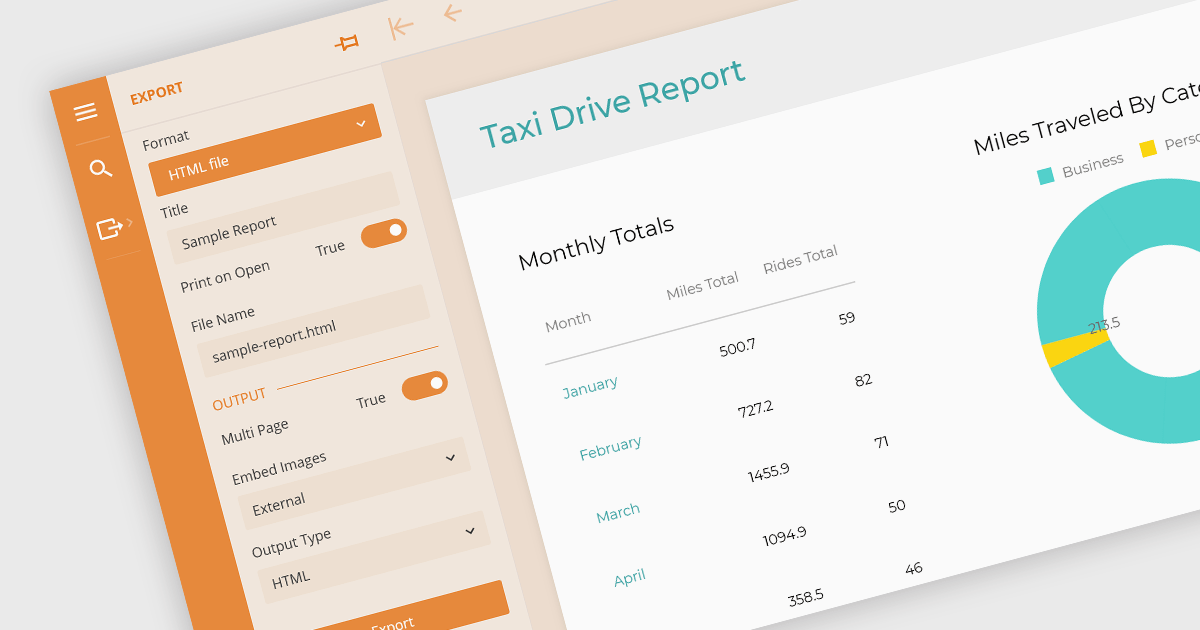
Being able to export to HTML is a valuable feature of a reporting application. Exporting reports to HTML files involves converting data visualizations and analytical summaries from a native format into web-friendly HTML pages. This allows for wider accessibility, sharing, and potentially embedding reports within websites. Static reports are transformed into interactive documents easily viewable on any device with a web browser. This format is ideal for sharing reports with collaborators, posting them online, or simply ensuring they remain accessible even if the original software becomes unavailable.
These Vue.js report components allow you to export reports to HTML files:
For an in-depth analysis of features and price, visit our comparison of Vue.js Reporting components.
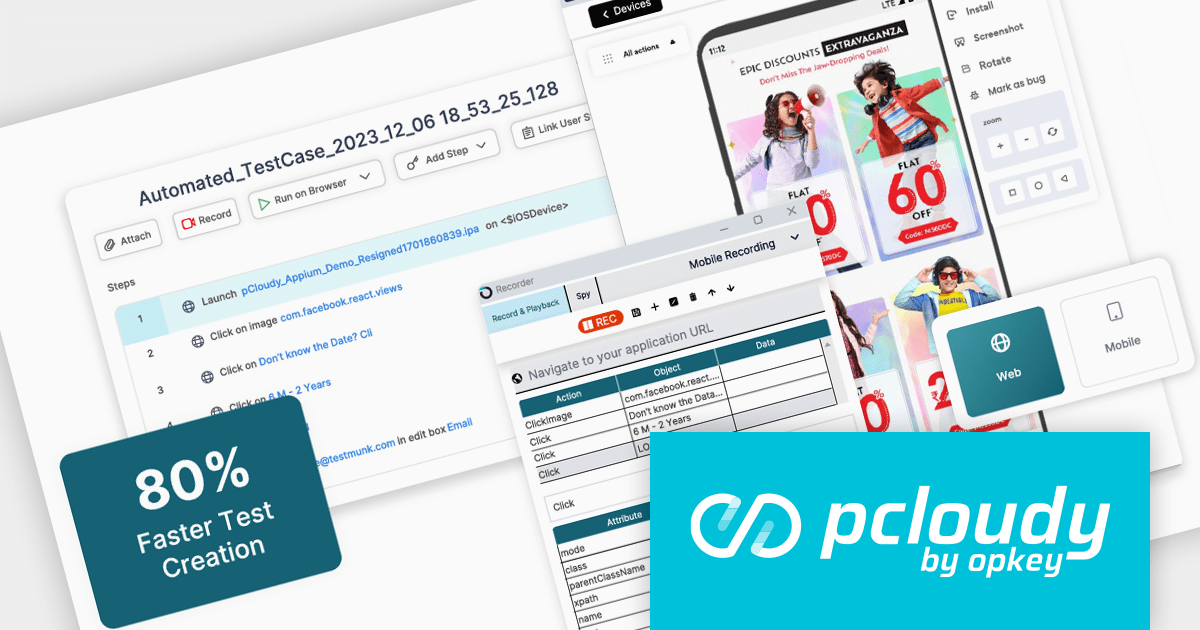
Pcloudy is a unified app testing platform that helps developers and testers ensure the quality and functionality of their applications across a wide range of devices and browsers. It provides a cloud-based infrastructure for manual and automated testing, offering access to thousands of real devices and browser combinations.
Pcloudy's 2024 platform streamlines app testing with a unified solution, catering to testers of all experience levels. Its codeless development tools and AI-powered features empower even non-technical testers to contribute. The platform boasts a comprehensive infrastructure of over 5,000 real devices and integrates seamlessly with CI/CD pipelines for efficient, future-proof testing across web, mobile, and desktop applications. This ensures flawless digital experiences and democratizes quality assurance, fostering collaboration within teams.
To see a full list of what's new in 2024, see our release notes.
Pcloudy is offered as a 1 Year Subscription, licensed per user, per parallel session. Licenses are available for Manual or Automated Testing, for Web or Mobile. See our Pcloudy licensing page for full details.
For more information, visit our Pcloudy product page.
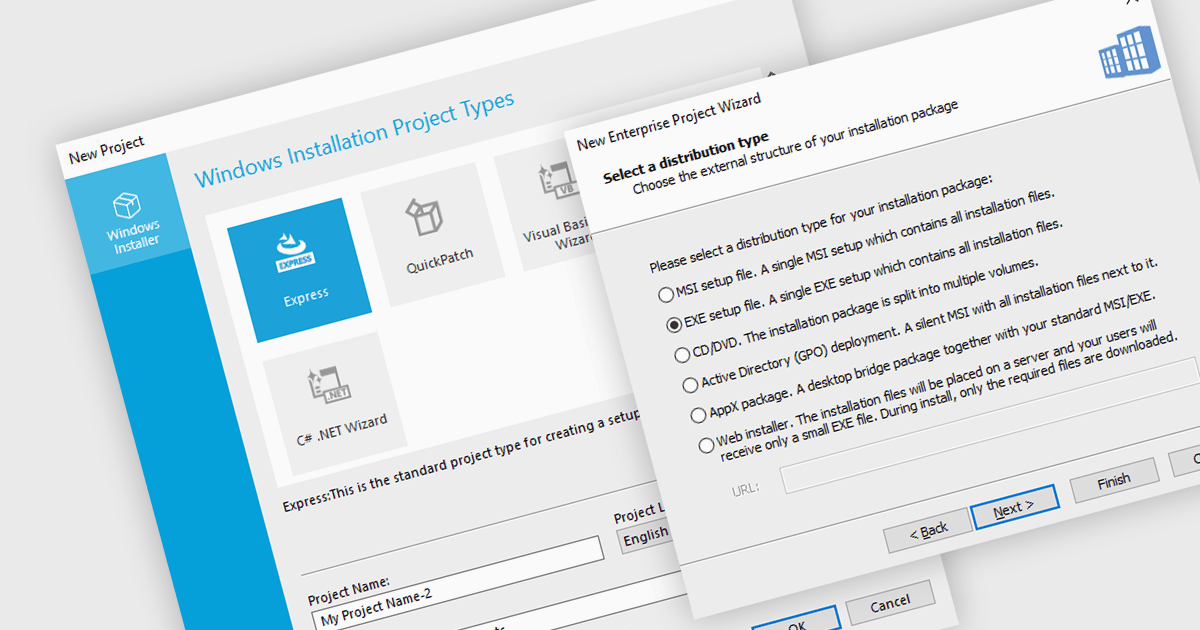
A new project wizard is a guided interface that assists users in creating an installer. It simplifies the process by presenting options and collecting necessary information step-by-step, saving time and reducing errors compared to manual configuration. They are user-friendly regardless of your experience, and are particularly helpful for complex projects with various settings, languages, or dependencies.
Several installation tools offer a new project wizard, including:
For an in-depth analysis of features and price, visit our comparison of installation tools.
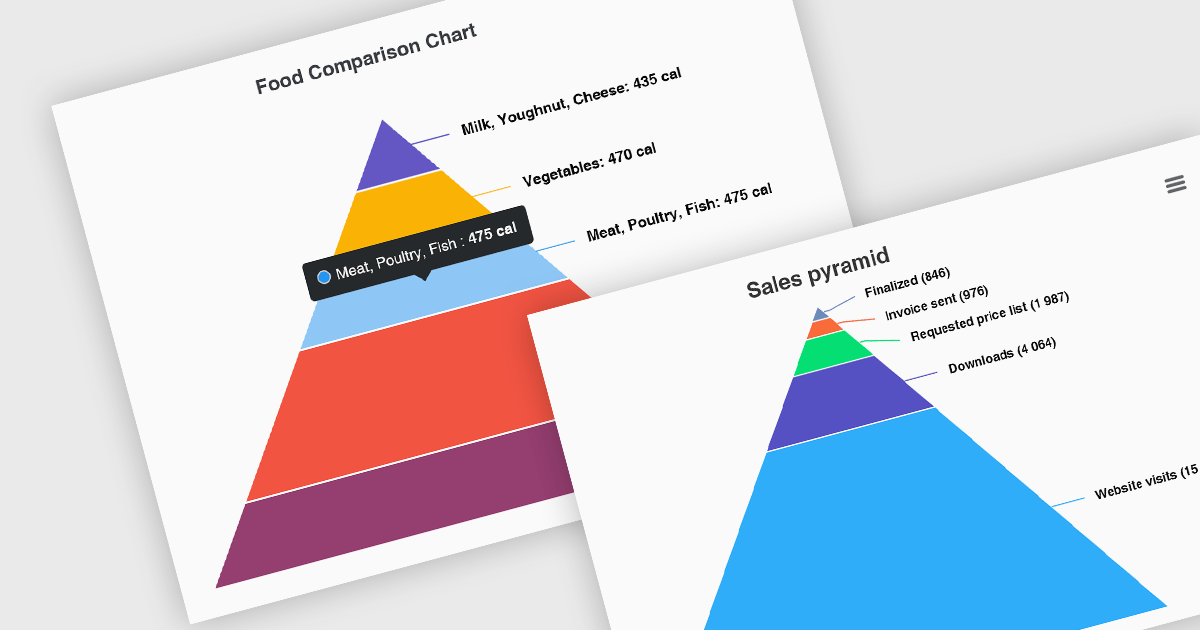
Pyramid charts, also known as triangle diagrams, utilize a triangular shape segmented into horizontal sections, each representing a level in a hierarchy, process, or simple dataset. Their strength lies in visually depicting hierarchical relationships, emphasizing the relative importance or size of each level through varying widths. The easily understood layout makes them ideal for communicating clear, singular data points in fields like sales funnels, population structures, and educational concepts.
Several Vue.js chart controls offer pyramid charts including:
For an in-depth analysis of features and price, visit our Vue.js chart controls comparison.





Tel: (888) 850 9911
Fax: +1 770 250 6199


