








Official Supplier
As official and authorized distributors, we supply you with legitimate licenses directly from 200+ software publishers.
See all our Brands.

An XSLT editor is a specialized software program designed to facilitate the creation, editing, and testing of XSLT (Extensible Stylesheet Language Transformations) stylesheets. These stylesheets transform XML documents into various formats like HTML, plain text, or PDF. XSLT editors offer benefits like syntax highlighting, code completion, debugging tools, and transformation previews, streamlining the development process and ensuring accurate and efficient transformations. They save developers time and effort by providing a dedicated environment tailored to the specific needs of working with XSLT.
Several Structured Document Tools provide XSLT editing including:
For an in-depth analysis of features and price, visit our Structured Document Tools comparison.
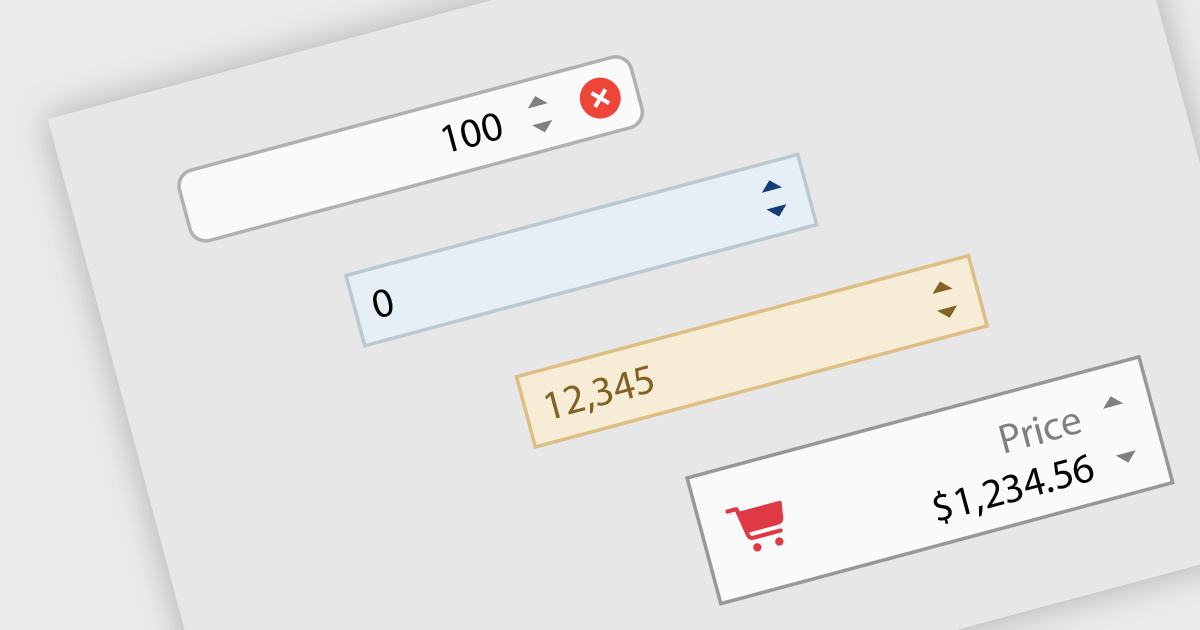
Numeric Spin data editor controls are intended for the efficient and precise input of numerical values. By combining an edit box with up/down spin buttons, users may either type to input directly or utilize the spin buttons to increase or decrease the value. This method promotes faster and less error-prone data entry than manual typing, particularly for large quantities or recurrent value revisions. Many spin editors include built-in validation, range limitations, data type selection, and formatting choices, which further improve data accuracy.
Many .NET WinForms data editor collections contain numeric spin components including:
For an in-depth analysis of features and price, visit our comparison of WinForms data editors.
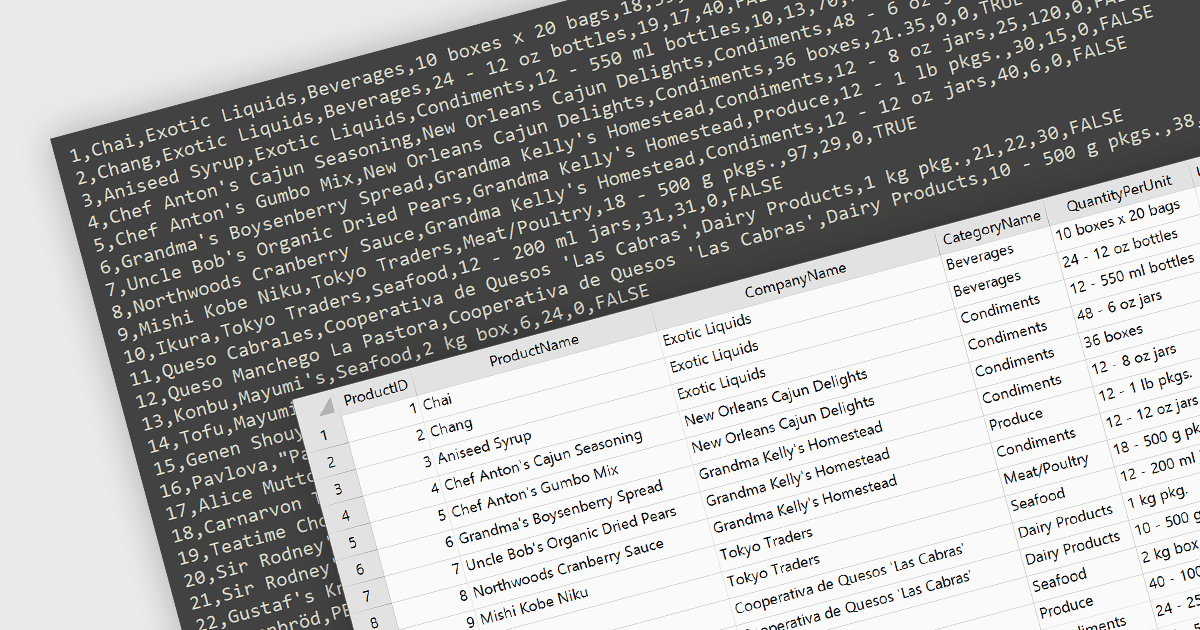
Integrating CSV import functionality in a spreadsheet streamlines data management by offering several key benefits. It simplifies transferring structured data from external sources, like databases or web scraped information, directly into the spreadsheet for analysis. This eliminates manual data entry errors and saves time. The straightforward CSV format ensures broad compatibility with various data sources, enhancing flexibility.
Several WinForms spreadsheet controls offer the ability to import CSV files including:
For an in-depth analysis of features and price, visit our WinForms spreadsheet controls comparison.
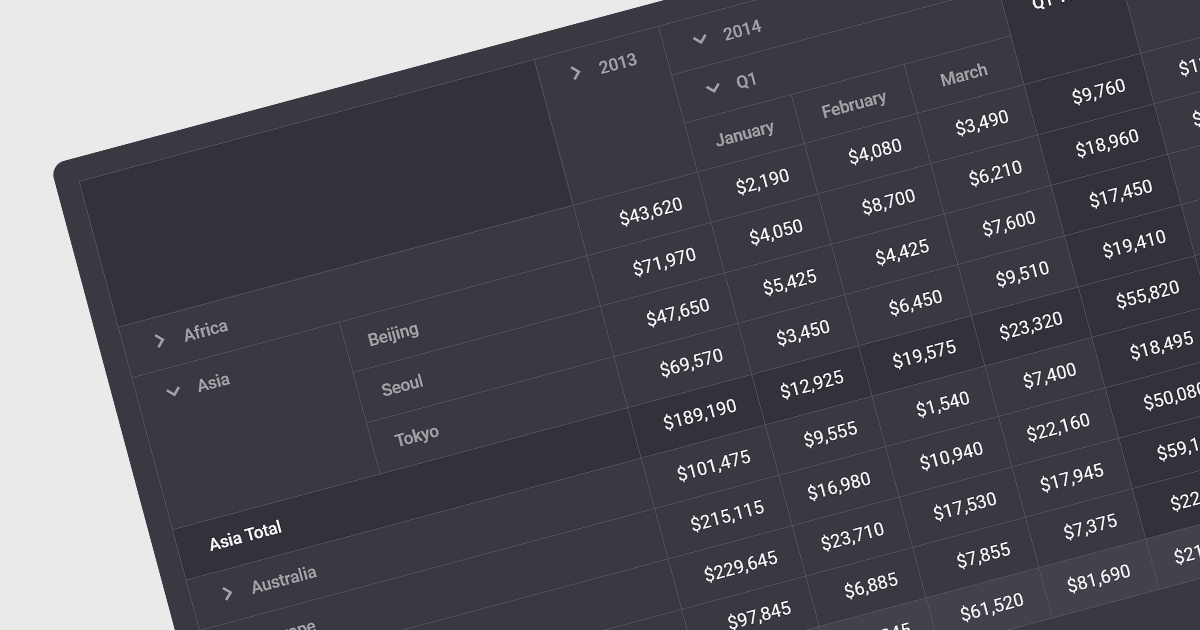
Drill-down capability within a grid control is a user-interactive feature that allows deeper exploration of summarized data. By clicking on specific cells or groups, users navigate down through hierarchical levels, uncovering increasingly granular details hidden within the aggregated view. This empowers informed decision-making by readily accessing both summarized overviews and underlying individual records, all within the familiar grid interface.
Several Angular grid controls offer drill-down capability including:
For an in-depth analysis of features and price, visit our Angular grid controls comparison.
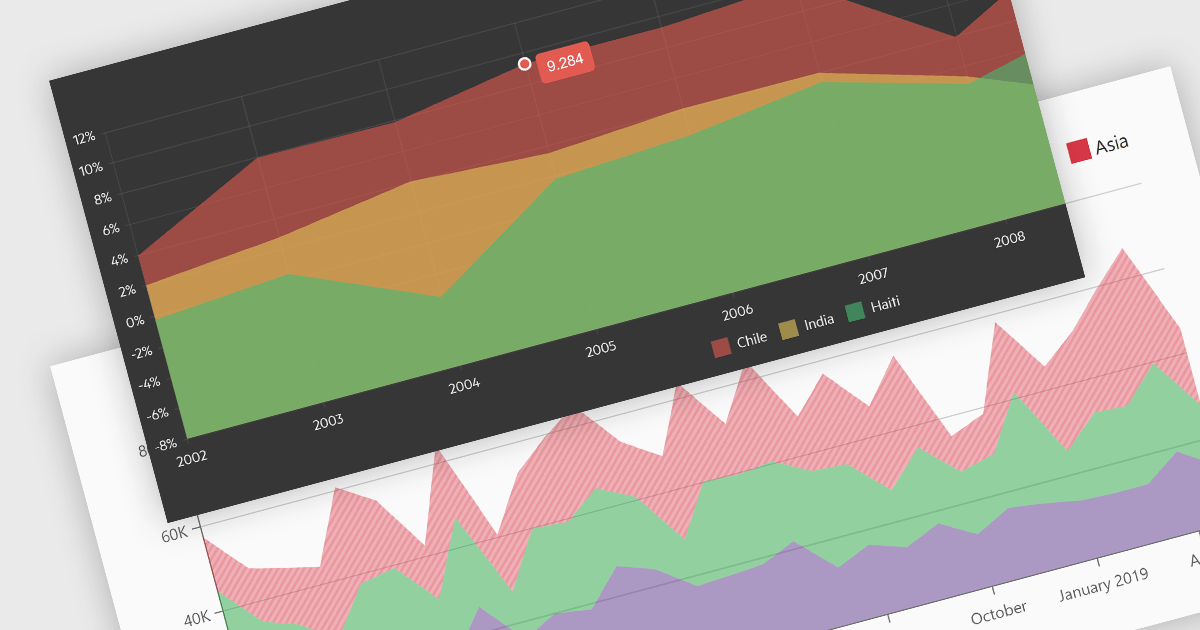
Area charts combine the strengths of line and bar charts, typically depicting how quantitative data changes over time. The area beneath the lines is shaded, emphasizing trends, comparisons between multiple data series, and the magnitude of change within each series. Ideal for showcasing cumulative totals and proportions, area charts excel in revealing trends and relationships within your data.
Several Blazor chart controls offer area charts including:
For an in-depth analysis of features and price, visit our Blazor chart controls comparison.





Tel: (888) 850 9911
Fax: +1 770 250 6199


