News Archive

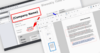
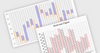
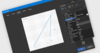
Export Dashboards as High-Quality SVGs

July 28, 2025Product Update
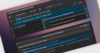
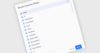
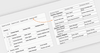
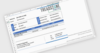
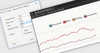
DevExpress BI Dashboard v25.1 now supports exporting scalable vector images for printing, sharing, or document embedding.

Find Commits Faster using Plain Language

July 25, 2025Product Update
GitLens for VS Code V17.3 supports natural language search across the Commit Graph and command palette, making it easier to find changes.

Ensure Accuracy in Every AI Content Suggestion

July 25, 2025Product Update
Oxygen AI Positron Assistant Enterprise V6.0 ensures AI-generated content is accurate and compliant with real-time validation and correction.

Display Hierarchical Data with TreeList Views

July 25, 2025Feature Highlight
TreeLists present hierarchical data in an expandable format, with built-in sorting, filtering, and editing to simplify display and management.

Improve App Packaging with PSADT v4 Support

July 25, 2025Product Update
PACE Suite 6.5 allows users to build and edit deployment scripts using the latest PSADT (PSAppDeployToolkit) syntax and structure.

Highlight Key PDF Content with Precision

July 25, 2025Feature Highlight
Rectangle annotations allow users to mark up PDFs, making reviews, approvals, and collaborative editing more effective and visually clear.

Integrate P&F Charts in your Financial .NET Apps

July 25, 2025Feature Highlight
Plot price-driven trends without time-based clutter, Point and Figure charts reveal key market movements using simple X and O logic.

Export Data Grids to JSON in Vue.js Applications

July 24, 2025Feature Highlight
Export tabular data in JavaScript Object Notation (JSON), a format that's easy to parse and integrate with other systems.

Find Content Fast in PDF Documents

July 24, 2025Feature Highlight
Let your application locate and extract specific text from PDF files, whether for navigation, validation, or data extraction.

Fine-Tune Lookups for Better Performance

July 24, 2025Product Update
Skyvia Data Integration adds a new Result Columns Picker for Lookup components, optimizing how data is fetched during integrations.

Export Blazor Grid Data to PDF with Custom Views

July 24, 2025Product Update
DevExpress Blazor v25.1 lets you create PDFs from the Blazor Grid with active filters, sorts and groupings preserved.

Compare Data with Smarter Aggregation

July 24, 2025Product Update
Stimulsoft Reports.JS enables comparison of time-based data using aggregation functions like Average, Sum, Min, and Max to tailor charts.

Enable PDF Handling in Go, PHP, and Rust Apps

July 23, 2025Product Update
Aspose.PDF adds new integrations to bring full PDF editing and conversion to Go, PHP, and Rust, making it easy to handle documents in your apps.

Upgrade Security with AES GCM for PDFs

July 23, 2025Product Update
Syncfusion Essential Studio for Xamarin offers advanced AES GCM encryption for PDFs, ensuring secure documents with modern protection.

Set Data Join Types for Better Dashboard Results

July 23, 2025Product Update
Stimulsoft Dashboards.WEB 2025.3.1 can now specify Full, Inner, Left, or Right joins when combining tables, improving data relevance.

Control and Verify OPC UA Server Access

July 23, 2025Product Update
Automa OPC-UAC v2.0 introduces support for username and password authentication to strengthen connection security.

Build native installers for Apple Silicon and Intel Macs

July 23, 2025Product Update
InstallAnywhere 2025 R1 adds Universal Binary packaging which ensures native performance on both Intel and Apple Silicon macOS systems.

Keep Visuals Aligned Across Excel Pages

July 22, 2025Product Update
Document Solutions for Excel, .NET Edition supports image and shape pagination, keeping visuals anchored to cells for improved readability.

Display Data Visually using Card Layouts

July 22, 2025Product Update
DevExtreme Complete v25.1 adds a new CardView which offers an image-friendly layout ideal for presenting data beyond traditional grids.

Analyze Multivariate Data via Python Dashboards

July 22, 2025Product Update
LightningChart Python v1.2 enables developers to add Parallel Coordinate charts to dashboards, making it easier to analyze multidimensional data.