


Official Supplier
As official and authorized distributors, we supply you with legitimate licenses directly from 200+ software publishers.
See all our Brands.
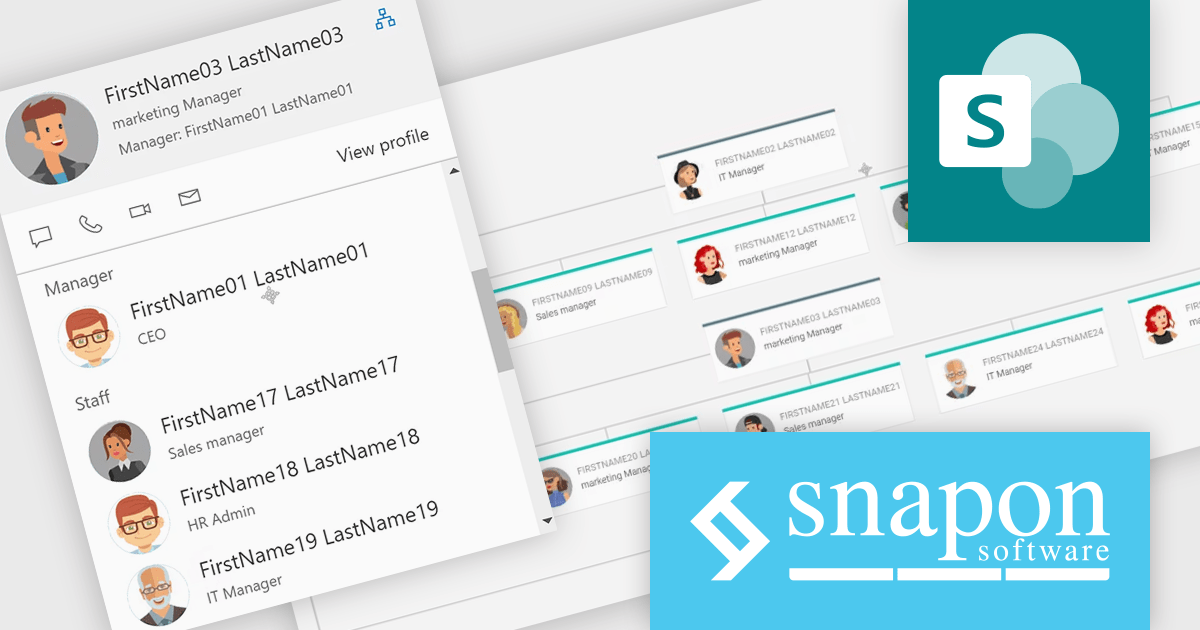
KWIZ Data View Plus products are a flexible solution for retrieving and displaying multiple data source types in modern, responsive, and fully customizable user interfaces, including KWIZ Calendar Plus, KWIZ Org. Chart, KWIZ List View Plus, KWIZ List Aggregator, and KWIZ Picture Gallery. Built for developers and solution architects, the suite supports consistent data presentation across calendars, org structures, lists, and galleries with extensible configuration to match application requirements. It helps teams deliver faster, clearer data experiences for use cases such as employee directories, project and resource scheduling, consolidated list reporting, and visual content browsing in enterprise applications.
The KWIZ Dataview Plus 1.6 update improves org chart usability by allowing the chart root to be reset to any selected person, so the UI can immediately refocus on that person’s manager, colleagues, and subordinates. For developers implementing or extending the component, this reduces the need to build custom navigation patterns for deep hierarchies and supports faster exploration of reporting structures with fewer expansion actions. It also preserves existing selection behavior, so opening persona views or customized cards continues to work as expected when users interact with nodes, helping teams add richer detail panels without sacrificing navigation speed or consistency.
To see a full list of what's new in version 1.6, see our release notes.
KWIZ Dataview Plus is licensed on an annual basis, requiring each user in your organization to be covered by an Annual Subscription license. Different levels are available to cater for different numbers of users. See our KWIZ Dataview Plus licensing page for full details.
For more information, visit our KWIZ KWIZ Dataview Plus product page.
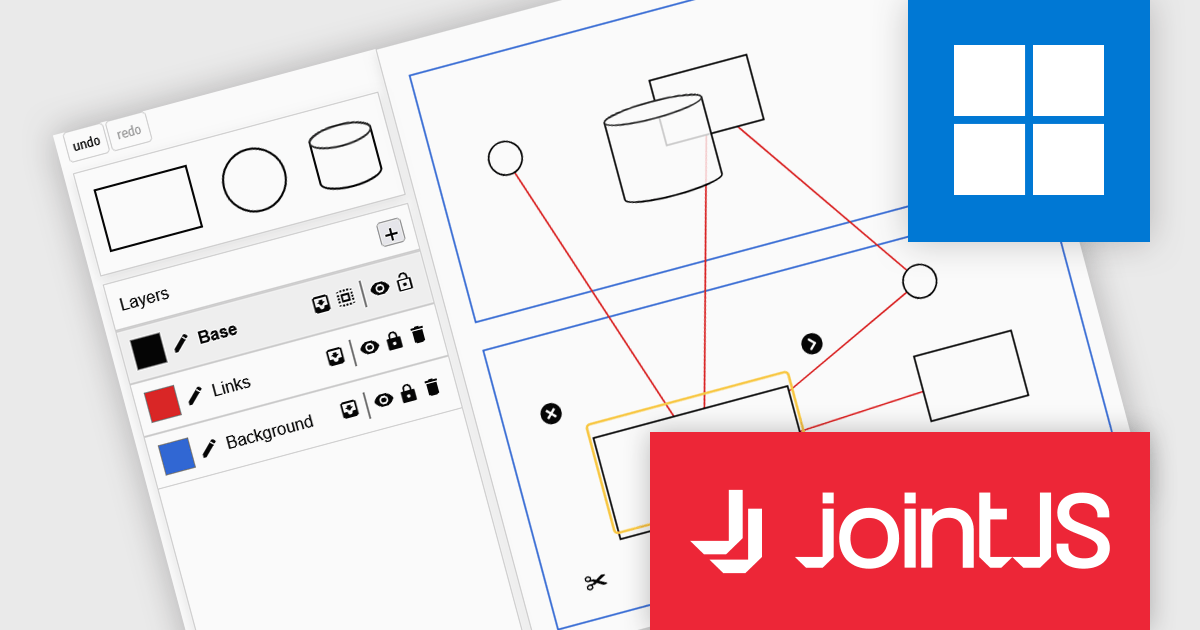
JointJS+ is a diagramming library that offers advanced features like custom shapes, data binding, and advanced layout algorithms, enabling you to create complex, interactive, and visually appealing diagrams. It includes a ready-to-use demo application that showcases its functionality and serves as a starting point for your own diagramming projects.
The JointJS+ 4.2 update introduces a redesigned Layers API that gives developers more control over diagram structure, interaction, and presentation by allowing cells to be grouped into independent layers with their own attributes, stacking context, and event flow. This enables clearer organization of complex graphs, more predictable z-index behavior, and the ability to apply targeted styling, filters, and animations at the layer level, all while maintaining backward-compatible event handling for smoother integration into existing applications.
To see a full list of what's new in v4.2, see our release notes.
JointJS+ is licensed per developer and is available as a Perpetual license with 1 year support and maintenance. See our JointJS+ licensing page for full details.
Learn more on our JointJS+ product page.
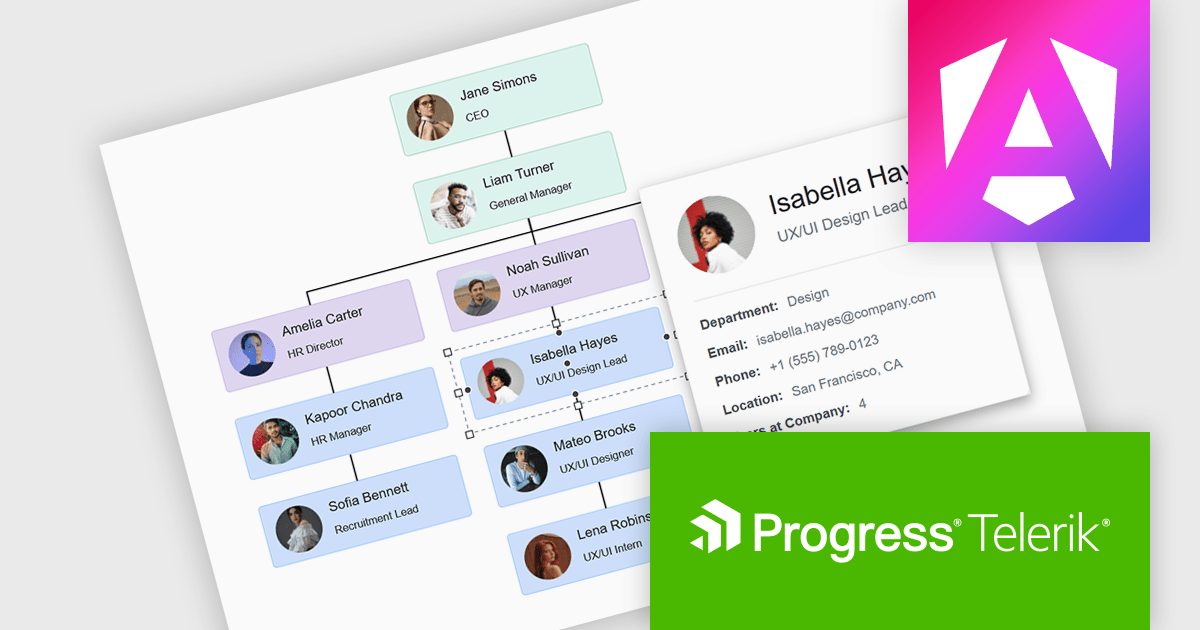
Kendo UI for Angular is a comprehensive suite of native Angular components designed to accelerate the development of modern web applications. Built from the ground up for Angular, it offers a wide range of UI elements, from data grids and charts to form controls and layout tools, ensuring high performance and integration with Angular's reactive architecture. Backed by robust documentation and regular updates, Kendo UI for Angular enables developers to build feature-rich, visually consistent applications with minimal overhead..
The Kendo UI for Angular 2025 Q4 update introduces diagram tooltips that provide developers with a straightforward way to surface additional information directly on hover without disrupting the structure of the diagram. This enhancement enables clearer communication of roles, statuses, and process details by presenting relevant context at the moment it is needed, reducing the need for extra labels or external references. As a result, developers can build diagrams that remain uncluttered and easy to navigate while still offering users immediate access to meaningful data.
To see a full list of what's new in 2025 Q4 (v21.0.0), see our release notes.
Kendo UI (which includes Kendo UI for Angular) is licensed per developer and has two licensing models: an annual Subscription License and a Perpetual License. The Subscription license provides access to the latest product updates, technical support, and exclusive benefits for a flat annual fee, and must be renewed to continue using the software. The Perpetual license is a one-time purchase granting access to the current released version and includes a one-year subscription for product updates and technical support. After this initial period, users can choose to renew the subscription element to continue receiving updates and support; otherwise, they may continue using the installed version available during their active subscription term but will forgo future updates and support. See our Kendo UI licensing page for full details.
Kendo UI for Angular is available in the following products:
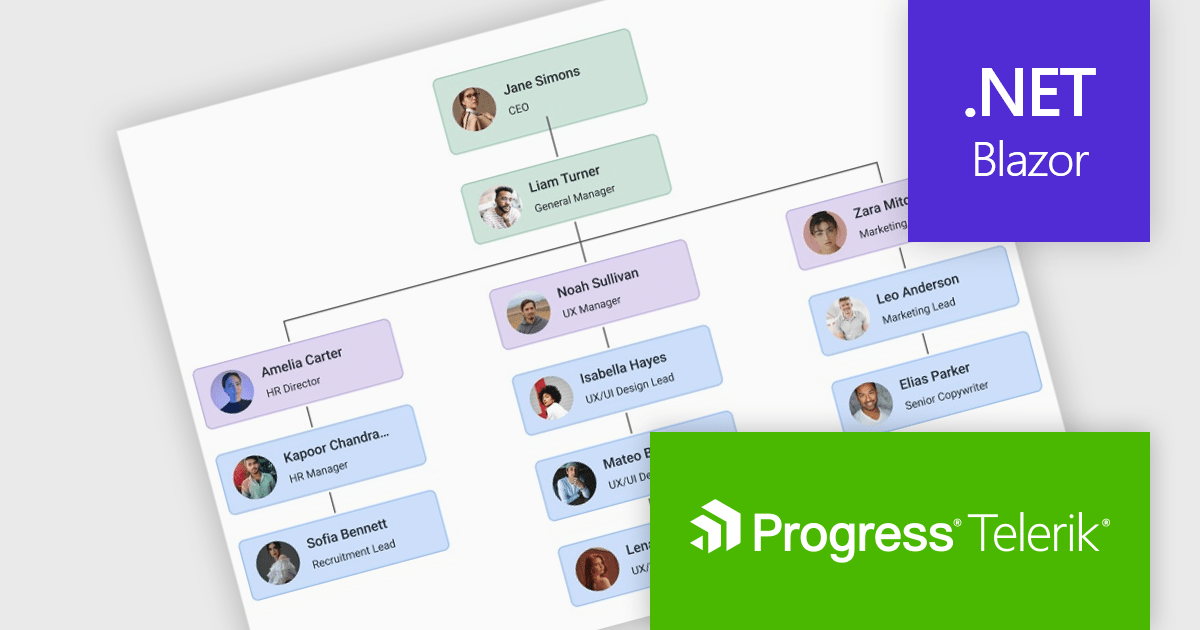
Telerik UI for Blazor is a comprehensive UI library that provides over 110 native and customizable Blazor components for building modern and feature-rich web applications. This professional-grade solution offers a complete set of components to satisfy all user interface requirements, saving time and effort in UI design.
The Telerik UI for Blazor 2025 Q3 update introduces a new Diagram component that enables developers to effectively model, display, and manage complex data, structures, and processes within their applications. With support for built-in layouts, customizable shapes, and flexible connections, the Diagram improves the creation of organizational charts, process flows, and other visual representations without requiring extensive manual coding. Workflow-ready elements and user interaction capabilities ensure that diagrams are not static images but functional components that respond to events and actions, making them a practical tool for building interactive and data-driven Blazor applications.
To see a full list of what's new in 2025 Q3 (v11.1.1), see our release notes.
Telerik UI for Blazor is licensed per developer and has two licensing models: an annual Subscription License and a Perpetual License. The Subscription license provides access to the latest product updates, technical support, and exclusive benefits for a flat annual fee, and must be renewed to continue using the software. The Perpetual license is a one-time purchase granting access to the current released version and includes a one-year subscription for product updates and technical support. After this initial period, users can choose to renew the subscription element to continue receiving updates and support; otherwise, they may continue using the installed version available during their active subscription term but will forgo future updates and support. See our Telerik UI for Blazor licensing page for full details.
Telerik UI for Blazor is available individually or as part of the following products:
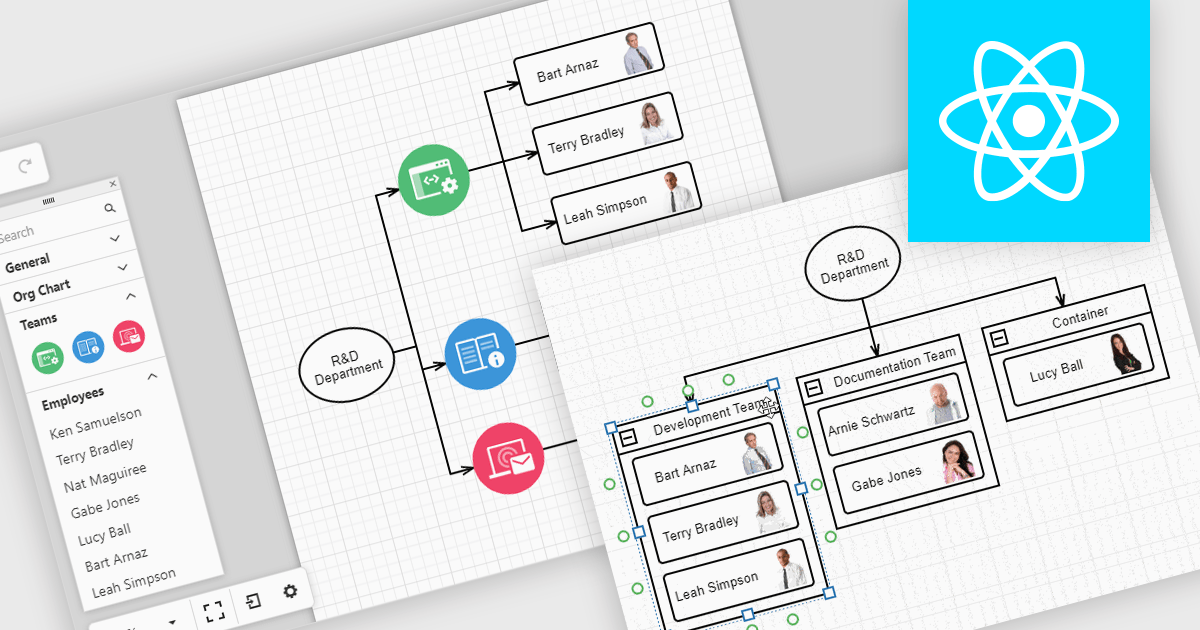
Diagrams in UI toolkits help turn complex data into easy-to-understand visuals that teams can interact with. For example, organizational charts show company structures and reporting lines in a layout that can be updated automatically from HR data. These charts can be expanded, collapsed, or reorganized with drag-and-drop tools, making it easier to understand team relationships and keep information up to date. Diagrams can also be used for workflows, decision trees, and network maps, giving teams a clear, flexible way to present and manage information.
Several React UI suites offer diagram controls including:
For an in-depth analysis of features and price, visit our React UI suite comparison.


Tel: (888) 850 9911
Fax: +1 770 250 6199


