


Official Supplier
As official and authorized distributors, we supply you with legitimate licenses directly from 200+ software publishers.
See all our Brands.
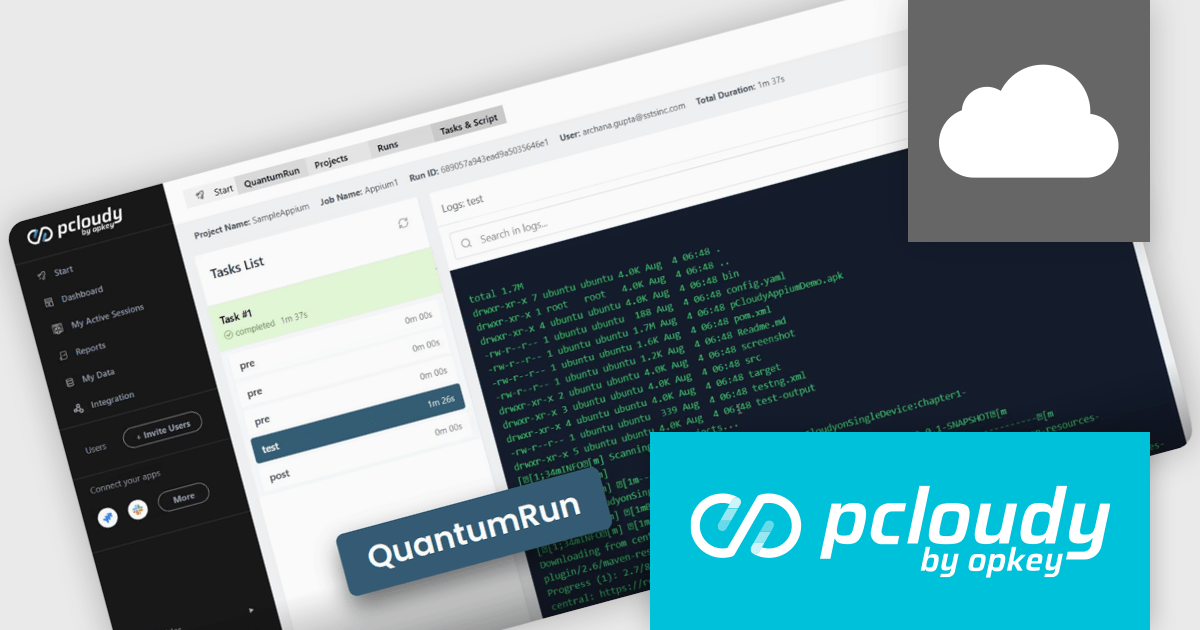
Pcloudy is a mobile app testing platform that provides access to a wide range of real devices hosted in the cloud. Designed to support both manual and automated testing, it enables developers and quality assurance teams to validate their apps across different devices, operating systems, and network conditions without needing a physical lab. Pcloudy integrates with popular tools like Appium, Jenkins, and various CI/CD pipelines, making it suitable for agile development environments. Its features include live device access, automated test execution, performance monitoring, and in-depth debugging tools such as logs, screen recordings, and screenshots.
The Pcloudy 7.6 update introduces QuantumRun, an AI-powered test orchestration engine designed to remove execution bottlenecks by automatically mapping tests to available infrastructure, optimizing scheduling, and running tests in parallel wherever possible. This ensures higher device utilization, reduces idle time, and eliminates the need for manual intervention in test execution workflows. For software developers, this means faster and more efficient test runs, shorter feedback cycles, and the ability to scale testing without adding operational complexity, ultimately improving productivity and release velocity.
To see a full list of what's new in 7.6, see our release notes.
Pcloudy is offered as a 1 Year Subscription, licensed per user, per parallel session. Licenses are available for Manual or Automated Testing, for Web or Mobile. See our Pcloudy licensing page for full details.
For more information, visit our Pcloudy product page.
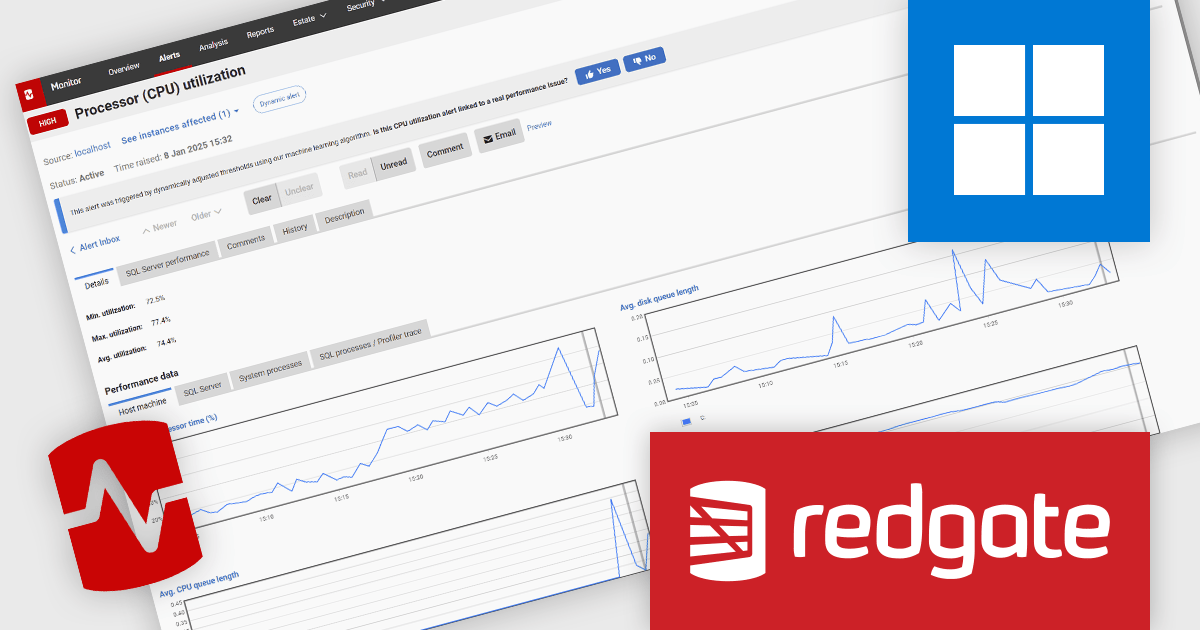
Redgate Monitor (formerly known as SQL Monitor) is a database monitoring tool that helps users quickly identify and fix performance problems on a variety of platforms, including SQL Server and PostgreSQL. It provides real-time monitoring, alerting, root cause analysis, and performance tuning recommendations. Redgate Monitor can be used by DBAs, developers, and operations teams to improve the performance of their databases.
Redgate Monitor uses Dynamic Alerting on Processor (CPU) utilization to automatically adjust alert thresholds based on historical usage patterns, ensuring that notifications are raised only when CPU behavior deviates significantly from expected norms. This approach reduces the need for manual threshold configuration, minimizes false positives from predictable workload spikes, and helps teams focus on diagnosing and resolving performance issues. By adapting to workload fluctuations and running all analysis locally to maintain data privacy, it supports more efficient, accurate, and scalable performance monitoring across diverse environments.
Redgate Monitor is licensed per server on an annual subscription basis. See our Redgate Monitor licensing page for full details.
For more information, visit our Redgate Monitor product page.
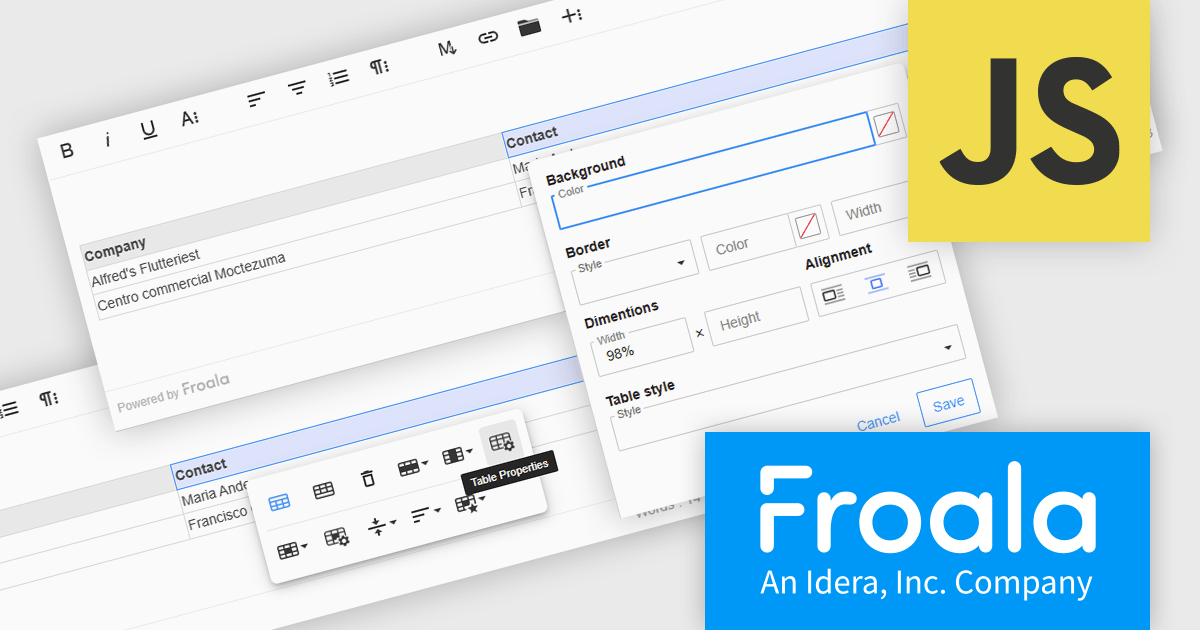
Froala Editor is a JavaScript-based WYSIWYG HTML editor that empowers developers to seamlessly integrate rich text editing functionalities into their applications. Despite its extensive feature set of over 100 options, Froala prioritizes user experience through a cleverly designed toolbar. Actions are categorized into four intuitive scopes, ensuring every feature is readily accessible while maintaining a clean and uncluttered interface. This balance of power and usability makes Froala Editor a versatile solution for a wide range of content creation scenarios.
The Froala Editor 4.6.0 update introduces a highly configurable Table Properties modal that brings detailed table customization into a single, accessible interface. Activated via the table toolbar, this modal lets users set background colors using a color picker that supports both RGB and hex values, applying changes uniformly across all cells. Table borders can now be precisely styled with user-defined color, thickness, and style options such as solid, dotted, dashed, and more. Users can also define table width and height in pixels or percentages, ensuring responsive layouts that adapt to various screen sizes. Alignment controls allow tables to be positioned left, center, or right within the content area. For enhanced readability, especially in data-intensive scenarios, alternating row colors can be toggled on or off to visually separate content. This update gives developers and content creators the granular control needed to create well-structured and visually consistent tables.
To see a full list of what's new in 4.6.0, see our release notes.
Froala Editor is licensed per product and domain. It is available as an annual or perpetual license with version upgrades and support. See our Froala Editor licensing page for full details.
For more information, visit our Froala Editor product page.
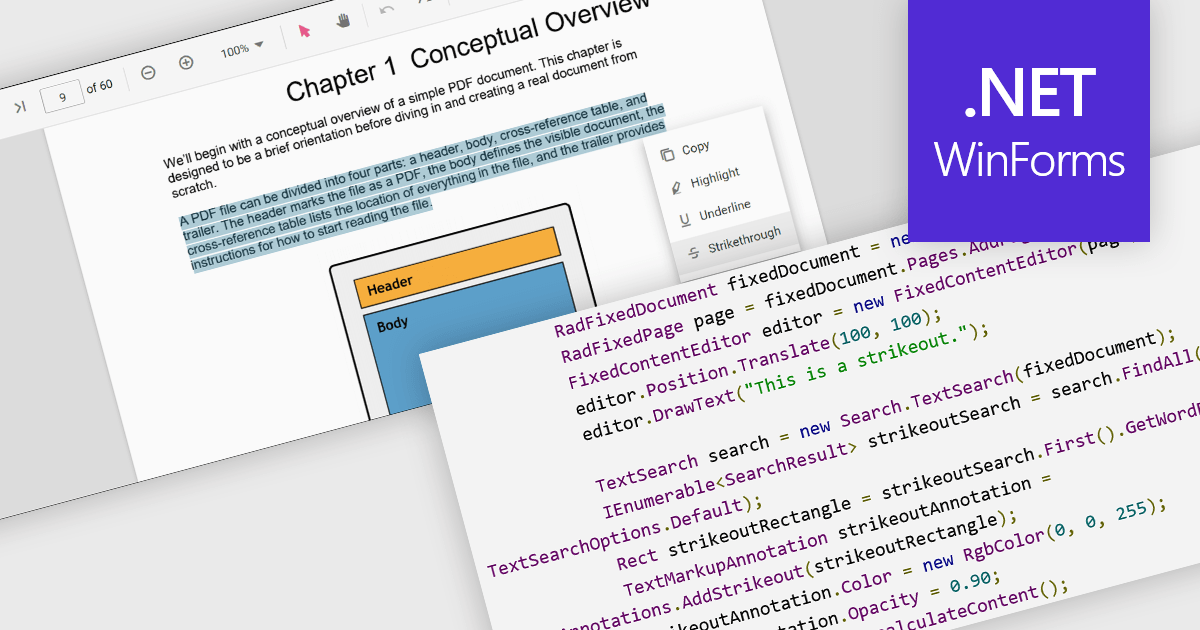
At a high level, strikethrough annotations, also known as strikeout or line-through markups, enable reviewers to visually indicate deletions or corrections within PDF text while preserving the underlying content. This annotation type belongs to the broader category of text markup annotations, which also includes highlighting, underlining, and squiggly underlines. Developers can customize properties like color, opacity, and associated notes or author metadata. Strikethrough annotations support interactive use cases, such as insert/edit/delete, event handling, and rendering consistency across different rendering engines.
Several WinForms PDF controls offer support for strikethrough annotations including:
For an in-depth analysis of features and price, visit our WinForms PDF controls comparison.
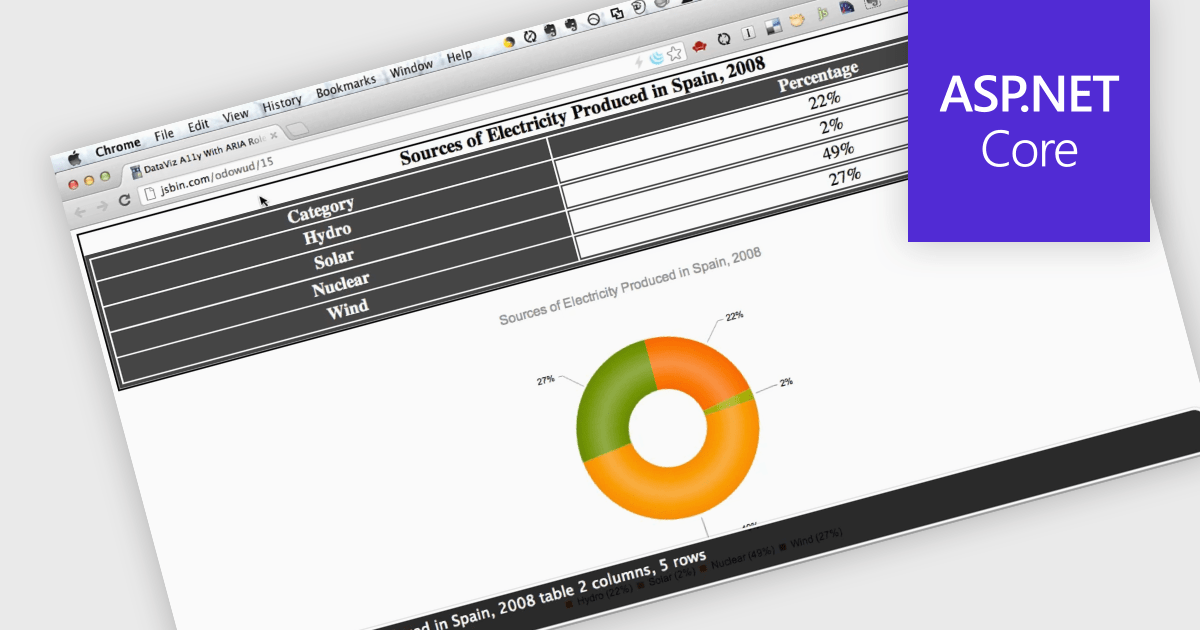
Screen readers, in the context of charts, are assistive technologies that convert digital text and interface elements into speech or braille, allowing users with visual impairments to navigate and understand graphical data on the screen. This involves adding semantic structure, descriptive labels, and metadata so the chart's content can be understood through auditory feedback, enabling users with visual impairments to understand trends, values, and relationships within the chart without needing to see the visual representation. Proper implementation not only improves usability, particularly in data driven environments, but also supports compliance with established accessibility standards such as WCAG (Web Content Accessibility Guidelines).
Several ASP.NET Core charting components support the use of screen readers, such as:
For an in-depth analysis of features and price, visit our comparison of ASP.NET Core chart components.


Tel: (888) 850 9911
Fax: +1 770 250 6199


