


Official Supplier
As official and authorized distributors, we supply you with legitimate licenses directly from 200+ software publishers.
See all our Brands.
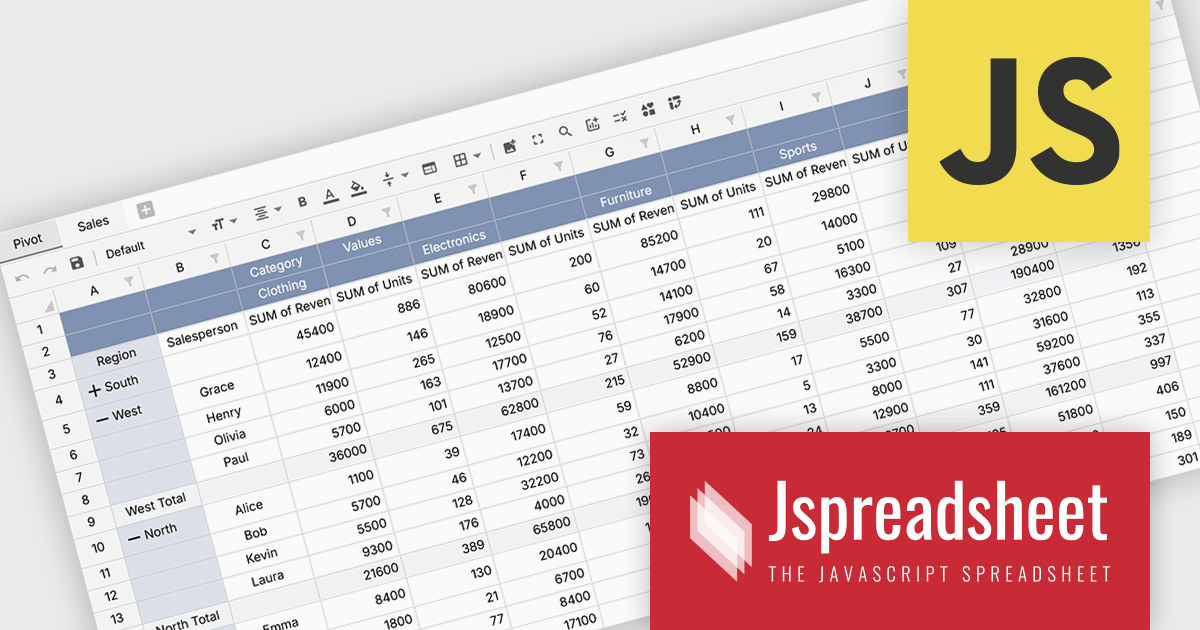
Jspreadsheet Pro is a flexible JavaScript-based spreadsheet solution that enables developers to create customizable, feature-rich data grids for web applications. It offers advanced formulas, data validation, and API integrations. Ideal for tasks like financial modeling, inventory management, and project tracking, it helps businesses efficiently manage and analyze data.
Jspreadsheet Pro introduces pivot table functionality that allows developers to summarize and analyze large datasets directly within browser based spreadsheet applications. It enables users to group data across multiple rows and columns, apply aggregation methods such as sum or average, and refine results through filtering and sorting. With built in spreadsheet formulas and cross worksheet references, developers can provide interactive data analysis capabilities without requiring external tools or additional backend processing.
Jspreadsheet Pro is licensed as an Annual or a Perpetual License with support and maintenance. We can supply any Jspreadsheet Pro license including new licenses, maintenance renewals, and upgrade licenses. See our Jspreadsheet Pro for full details.
For more information, visit our Jspreadsheet Pro product page.

Handsontable is a JavaScript library designed to help developers build interactive data grids into their web applications. Offering a familiar spreadsheet-like interface, it allows users to edit, sort, and filter data with ease. Highly customizable and compatible with popular frameworks like React and Angular, Handsontable empowers developers to build robust data manipulation features into their web applications.
The Handsontable 17.0.0 update adds a new MultiSelect cell type that allows a single cell to hold multiple values, making it well suited for data such as tags, user roles, product categories, or shipment contents. Instead of restricting entries to one option, users can choose any number of items from a dropdown interface that includes search and filtering capabilities for quickly locating options. Full keyboard navigation ensures efficient interaction for power users.
To see a full list of what's new in version 17.0.0, see our release notes.
Handsontable is licensed per developer and is available as an Annual or Perpetual license with 1 year support and maintenance. See our Handsontable licensing page for full details.
For more information, visit our Handsontable product page.
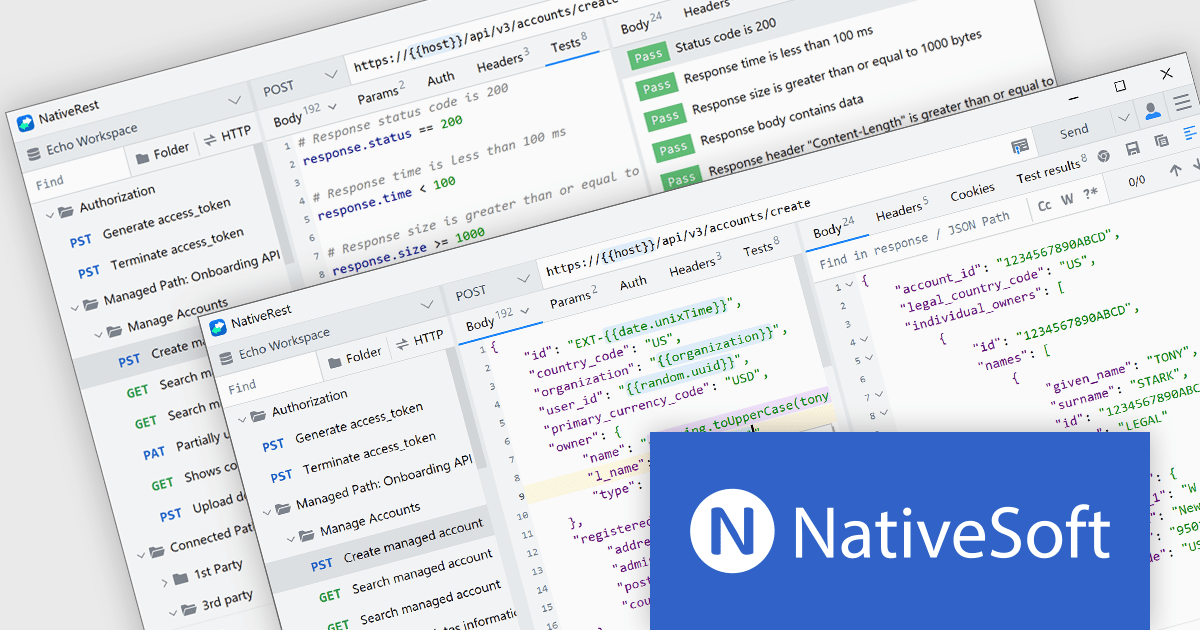
NativeSoft is a software company that develops high-performance, native desktop tools designed to improve developer productivity across multiple platforms. It focuses on building memory-efficient, cross-platform applications using native technologies rather than web-based frameworks, enabling faster execution and lower resource consumption. Its products are aimed at software engineers and technical teams who require responsive, reliable tooling for tasks such as development, debugging, and system optimization, with an emphasis on performance and precision.
Its leading product, NativeRest, is a native desktop REST client, designed to provide a fast, lightweight, and efficient alternative to traditional API testing tools. Built using native technologies, it delivers high performance and low memory usage while enabling developers to create, send, and manage HTTP requests with precision. It supports API exploration, debugging, and testing, offering a responsive user experience across Windows, macOS, and Linux. NativeRest is positioned for developers who value speed, reliability, and a clean, distraction-free interface when working with RESTful services.
Through its collaboration with NativeSoft, ComponentSource brings modern, high-performance native developer tools to its global software marketplace. This partnership enables organizations to efficiently procure and manage NativeSoft products, while benefiting from responsive, resource-efficient applications that support API development and testing across major desktop platforms, backed by dependable licensing and support services.
For more information, visit our NativeSoft page
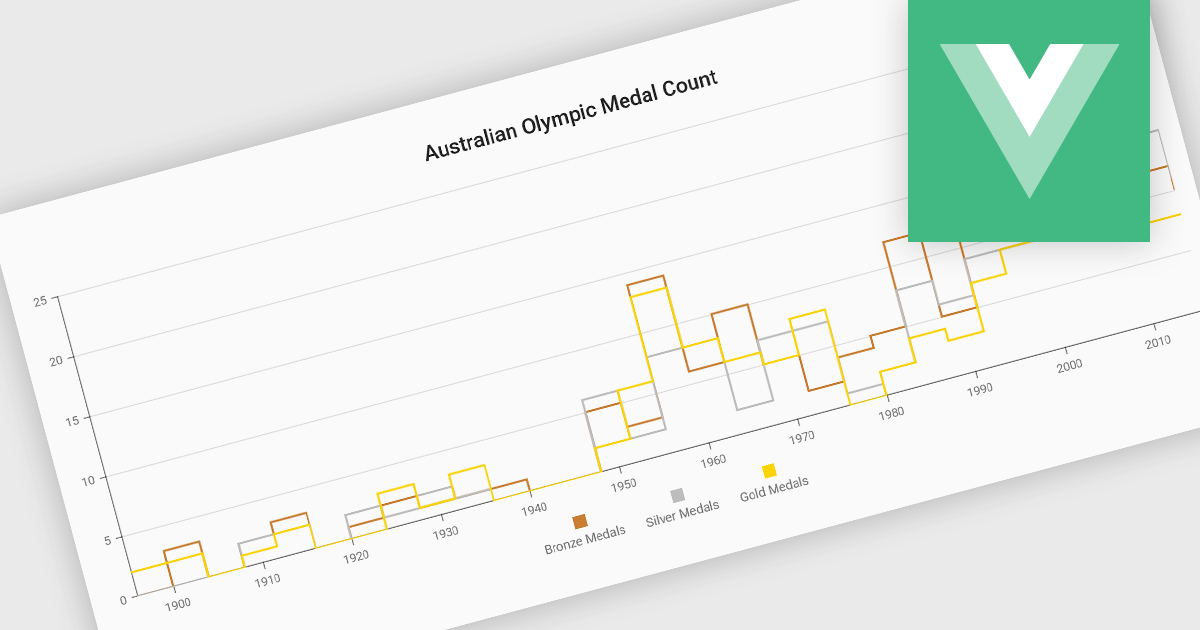
Step line charts are a variation of line charts that display changes between data points as a series of horizontal and vertical segments rather than diagonal lines. This structure highlights discrete transitions between values, making it easier to show when a change occurs and how long a value remains constant before the next update. Step line charts are useful for representing processes where values shift at specific moments, such as pricing tiers, system states, or configuration thresholds. By clearly separating periods of stability from points of change, the chart type helps developers and analysts interpret state-based or event-driven data with greater precision.
Several Vue.js chart components support the step line chart type, including:
For an in-depth analysis of features and price, visit our comparison of Vue.js charting components.
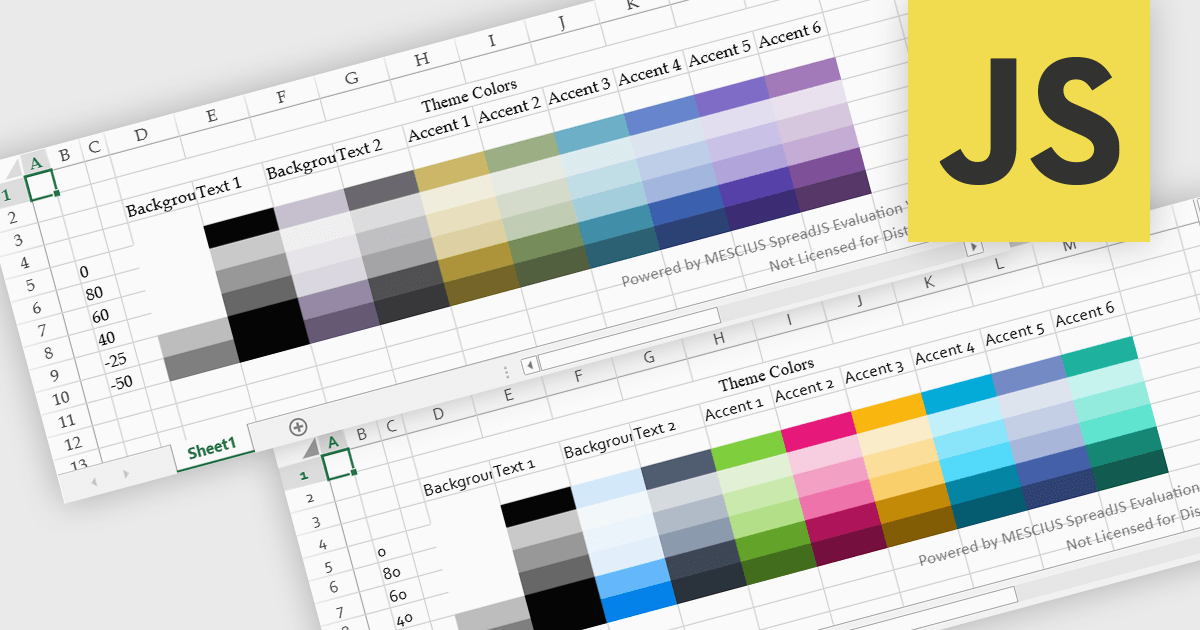
Spreadsheet themes provide a consistent visual style by applying coordinated colors, fonts, and formatting across an entire workbook. Instead of manually styling individual elements, users can quickly apply a theme to ensure tables, charts, and data ranges follow the same design. This improves readability, enhances data presentation, and helps maintain a professional and cohesive look across reports. Themes are particularly useful when creating business dashboards, financial reports, or shared team documents, where consistent formatting and clear visual hierarchy make data easier to interpret and align with company branding.
Several JavaScript spreadsheet controls offer support for applying themes including:
For an in-depth analysis of features and price, visit our JavaScript spreadsheet controls comparison.


Tel: (888) 850 9911
Fax: +1 770 250 6199


