


Official Supplier
As official and authorized distributors, we supply you with legitimate licenses directly from 200+ software publishers.
See all our Brands.
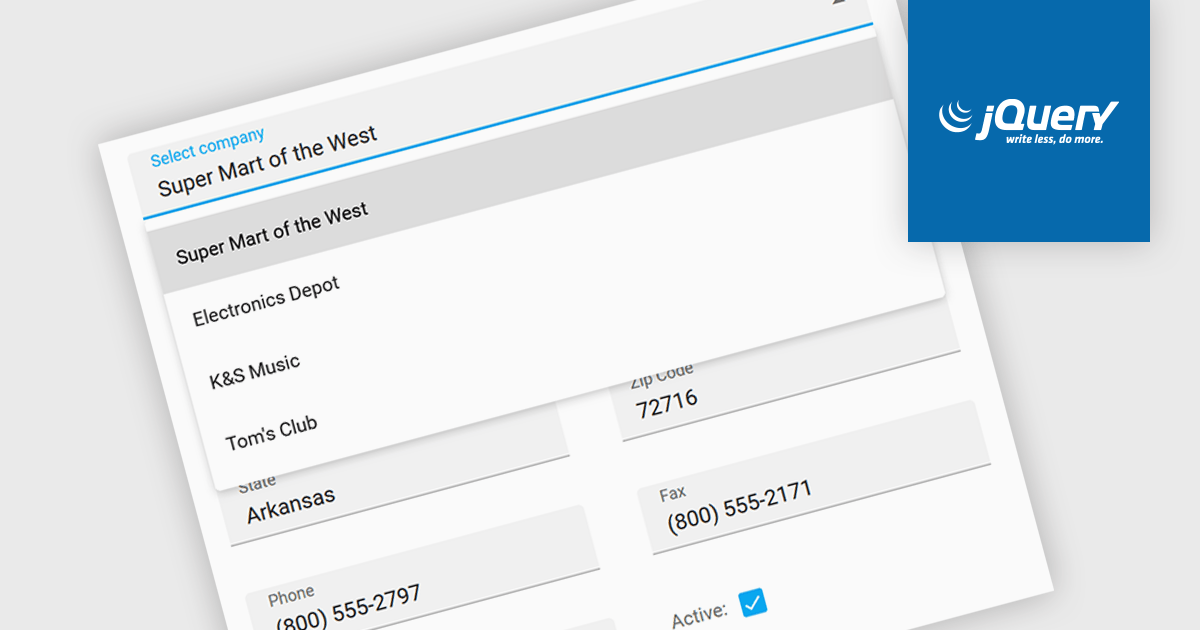
Listboxes are graphical user interface elements that display a list of items from which a user can select one or more. They are commonly used to present options, choices, or data in a compact and organized manner. Their utility lies in their ability to simplify user interaction by providing a clear and visually appealing way to navigate and choose from a predefined set of items, making them essential components in various applications, from simple forms to complex data management systems.
Several jQuery data editor collections can provide you with a listbox including:
For an in-depth analysis of features and price, visit our jQuery data editors comparison.
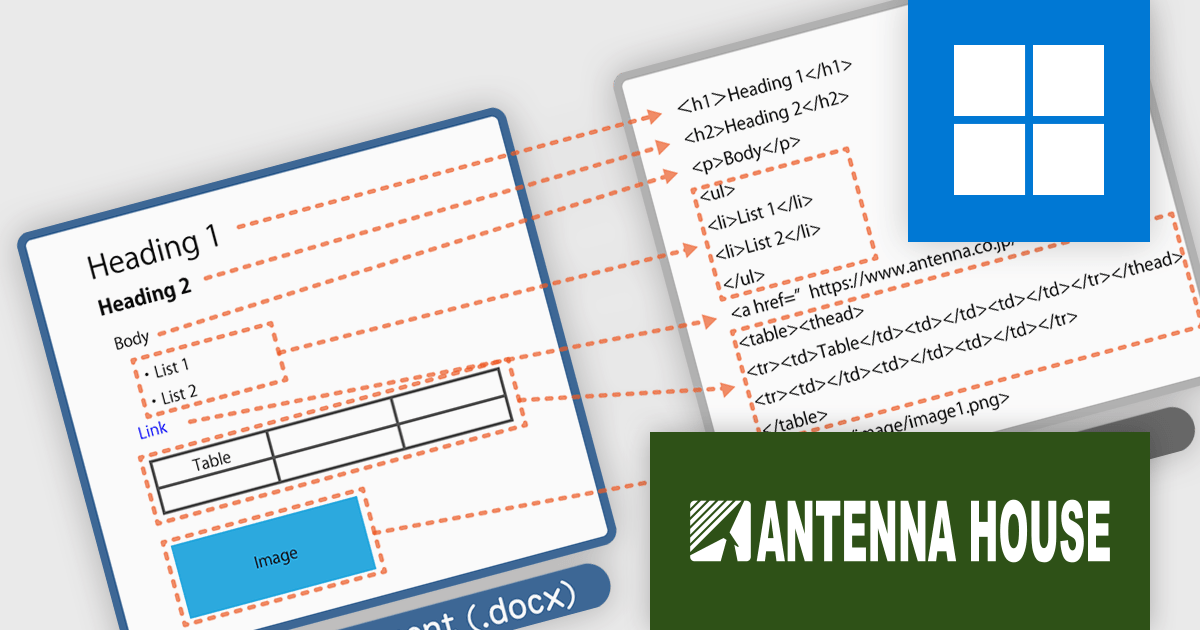
HTML on Word by Antenna House is a software development tool that allows developers to create, edit, and manage HTML content directly within Microsoft Word. By seamlessly integrating HTML capabilities into the familiar Word interface, it bridges the gap between these two commonly used applications.
HTML on Word offers a streamlined workflow by providing a visual HTML editor within Word. This eliminates the need to switch between applications and simplifies the process of understanding and modifying HTML structure. It removes Word's proprietary tags and outputs clean HTML files that conform to HTML5 and XHTML 1.0. By ensuring the output is valid HTML, it helps prevent errors and ensures compatibility across various platforms and browsers. This tool is especially valuable for developers working with both HTML and Word documents, such as those creating technical documentation or online content.
HTML on Word is licensed per computer and is available as a Perpetual License. See our HTML on Word licensing page for full details.
Learn more on our HTML on Word product page.

PrizmDoc is a comprehensive REST API platform designed to streamline the integration of secure document viewing, editing, and processing into web applications. Beyond standard features like redaction and annotation, PrizmDoc leverages advanced AI-powered tools to automate and optimize document handling processes, significantly reducing manual effort and boosting productivity. This enables businesses to enhance their document workflows, improve security, and deliver a superior user experience.
On Thursday, September 12 at 1:00 PM EST Accusoft is presenting an exciting LIve Webinar: Supercharge Your Document Workflow: Unleashing AI-powered Secure Document Processing with PrizmDoc. See how PrizmDoc's secure AI features can save valuable development time and improve the overall efficiency of document workflows by:
Register today and discover how you can harness your ECM's full potential through the power of PrizmDoc and AI.
PrizmDoc Viewer is available as Self-Hosted, Cloud-Hosted or Private Cloud-Hosted deployments. Billed on an annual subscription basis, you will need to renew your license each year to continue to use the software. The price is based on the number of servers or the number of transactions you require, depending on your deployment method. See our PrizmDoc Viewer licensing page for full details.
For more information, see our PrizmDoc Viewer product page.
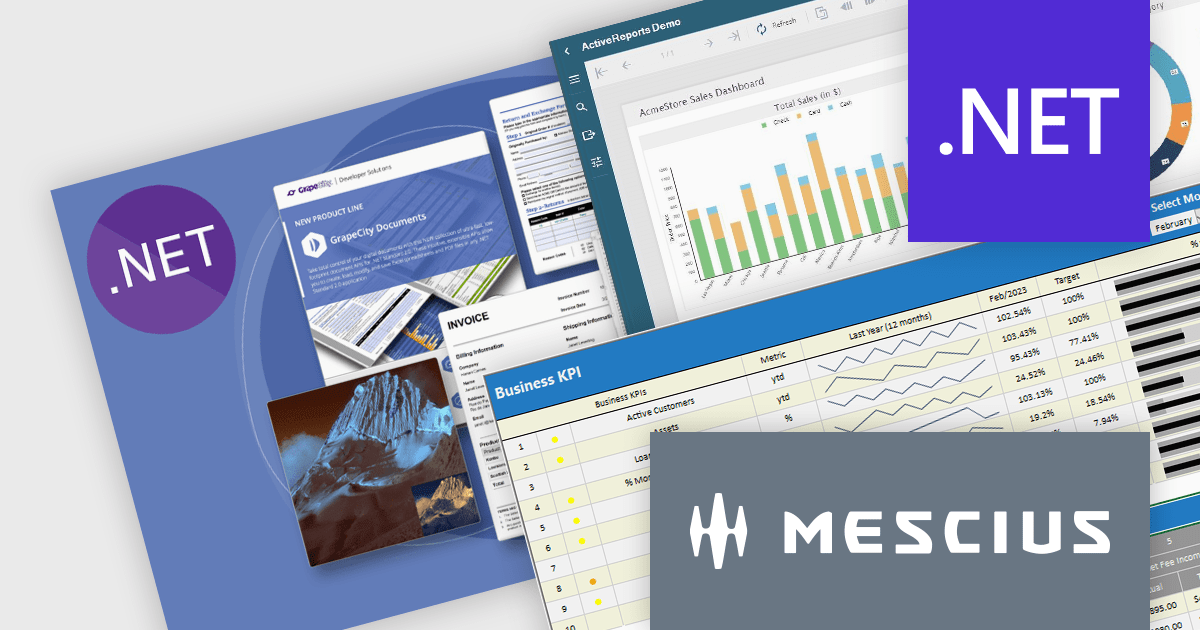
It's a great time to update your MESCIUS software subscriptions. Now through October 4th 2024, we are offering expired MESCIUS customers the ability to re-start their expired subscriptions at the discounted renewal rate* instead of paying for an upgrade or late renewal. This offer is valid for the following MESCIUS subscriptions:
Don't miss out on the opportunity to get back on an active subscription for your product and enjoy all of the benefits of an updated toolkit, including:
Click the link above for your product to view the special pricing or contact us for a quote.
* This offer requires verification of upgrade eligibility. Some restrictions apply.
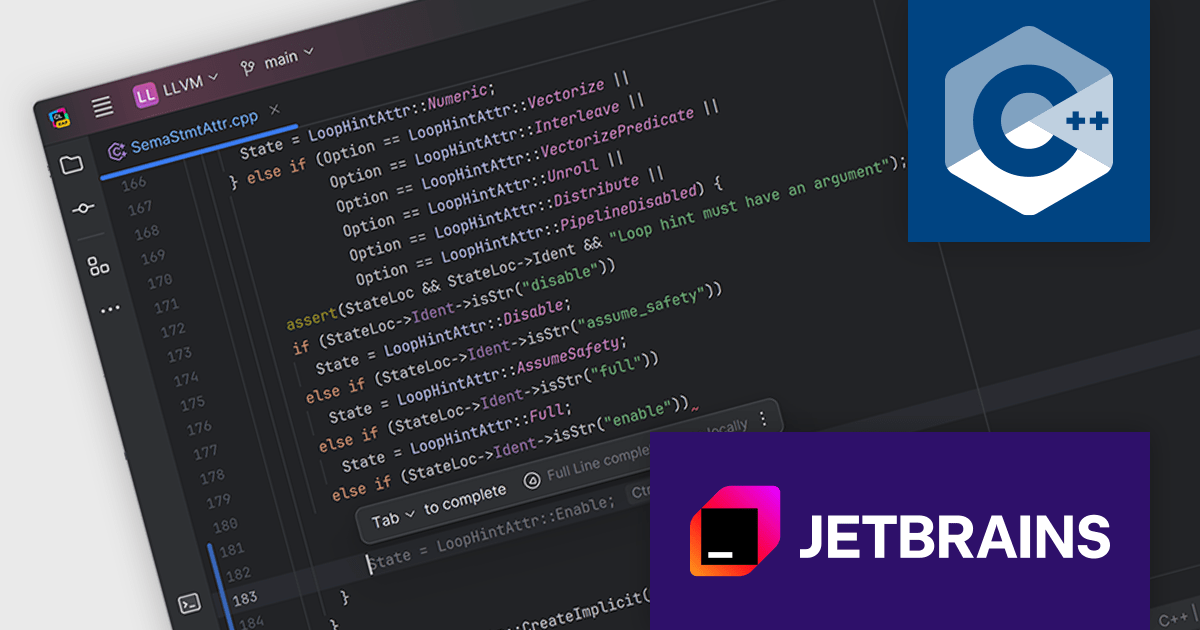
CLion is a cross-platform Integrated Development Environment (IDE) created by JetBrains specifically for C and C++ development. It boasts intelligent code completion, navigation, and refactoring features to streamline your workflow. CLion integrates with popular debuggers and testing frameworks, and supports various build systems for seamless project management.
CLion 2024.2 adds full line code completion for C++. By utilizing a locally run deep learning model, it can suggest entire lines of code, saving you valuable time and effort. Unlike traditional code completion tools that rely on external data sources, CLion's feature operates entirely within your IDE, ensuring your code remains private and secure. This approach empowers you to write code faster and more accurately, without compromising your data privacy.
To see a full list of what's new in version 2024.2, see our release notes.
CLion is licensed per user as a commercial annual subscription. We can supply New Subscriptions, Subscription Renewals, Lapsed Subscription Renewals, and Additional Developer Licenses. See our CLion licensing page for full details.
CLion is available to buy in the following products:


Tel: (888) 850 9911
Fax: +1 770 250 6199


