AnyChart 8.5.0

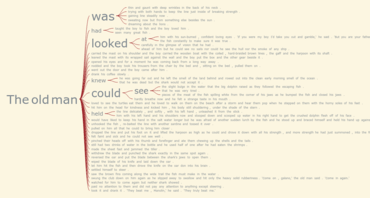
New Word Tree chart to visualize and analyze a data set of words.
January 3, 2019
New Version

Features

  • Word Tree - A Word Tree chart is a visualization of a set of words in a hierarchical way. It can be used to show which words most often follow or precede a target word or to show a hierarchy of terms. The font size of words represents their weight - the frequency/number of children.
  • Surface Chart - Surface chart (3D Surface plot) displays a set of three-dimensional data as a mesh surface and is used when you need to find the optimum combinations between two sets of data. The colors and patterns in this chart indicate the areas that are in the same range of values.
  • Multi Series Charts Grouped by Series - Sometimes it is useful to visualize comparison in a different way - group columns by series. Now you can enable this mode for all basic cartesian charts.
  • Y Scroller - Now you can add both X and Y Scrollers to your charts.
  • New chart constructors added to make API more uniform.
  • Ordinal Scale Modes are introduced to cover certain Area and Line Series Display Requirements (API).
  • Cartesian Series Multiple X Mode: Now you can display cartesian charts with several points with the same argument.
Word Tree

AnyChart JS

JavaScript charts designed to be embedded and integrated.

Got a Question?

Live Chat with our AnyChart licensing specialists now.