MindFusion.Charting for JavaScript 1.2

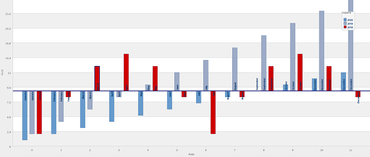
Adds the ability to specify the origin of a chart axis.
August 24, 2020
New Version

Features

  • Axis origin - New property lets you specify the origin of a chart axis.
  • New SimpleSeries constructor override allows you to specify a list with tooltips for the newly created series.
  • New drawLeftFromPoint method allows you to render text which is left-aligned.
  • New Font class methods allow you to deserialize and serialize Font instances from/to Json objects.
  • New properties give you better control over rendering of labels in bar charts.
  • All series can now accept a simple JavaScript array-s as arguments instead of Collections.List instances.
  • ToolTip class extended with new properties that allow you to customize the appearance and position of tooltips.
  • Color.knownColors field lists all standard CSS color names.
  • Brush and Pen instances can now be created with simple strings that specify the HTML code of the color as an argument instead of color objects.
  • New BiaxialChart property specifies the horizontal alignment of Y-axis labels.
Specify the origin of a chart axis

MindFusion.Charting for JavaScript

Interactive charts, gauges and dashboards written in pure JavaScript.

Got a Question?

Live Chat with our MindFusion Group licensing specialists now.