MindFusion.Charting for JavaScript

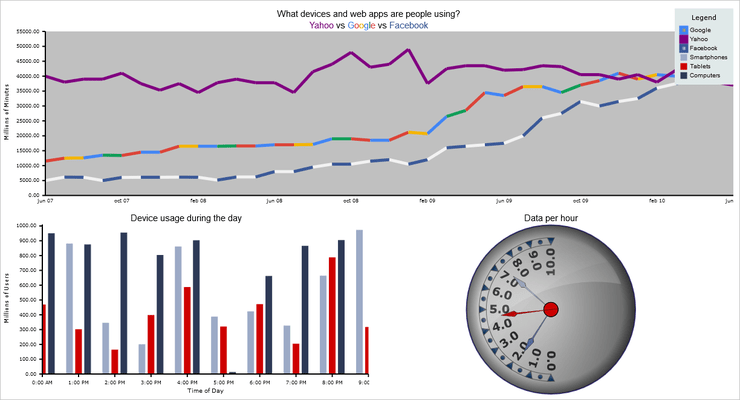
MindFusion.Charting for JavaScript combines 2D and 3D charts, financial graphs, gauges and dashboards. It includes an elegant API, a rich event set, unlimited number and type of data series and everything else you might need to create the perfect data visualization in JavaScript and HTML.

MindFusion.Charting for JavaScript Features

  • Support for All Common Chart Types - The JavaScript chart supports all popular chart types and their variations: pie, doughnut, bar, column, radar, polar, line, area, scatter, bubble, step charts. The elegant API allows you to combine series of different types on a single plot. You can also add unlimited number of legends, a title and a subtitle, labels on various chart elements.
  • 3D Bar Charts in JavaScript - MindFusion uses WebGL to create 3D bar...

Latest News

MindFusion.Charting for JavaScript V2.0
January 13, 2022New Version
Area charts are now rendered relative to the axis origin.
MindFusion.Charting for JavaScript 1.2
August 24, 2020New Version
Adds the ability to specify the origin of a chart axis.

Prices from: $ 294.00

Developer License - Licenses are perpetual. One license is required per developer. You are NOT required to pay any additional distribution, runtime, royalty, or per-end-user license fees. Site-wide...

MindFusion.Charting for JavaScript is also available in:

Got a Question?

Live Chat with our MindFusion Group licensing specialists now.

MindFusion Group
As official and authorized distributors, ComponentSource supplies you with legitimate licenses directly from MindFusion Group.
Component Type
  • JavaScript
  • jQuery

Recent Awards

PublisherPublisherPublisher