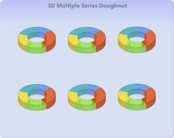
Data visualization components implement the functionality to view data in tables or data grids, as simple charts or complex graphs and enables you to create sophisticated management dashboards using gauges, maps and flowcharts.
Advanced data visualization for more informative reports.
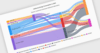
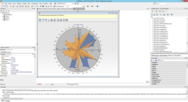
Nevron Map for SSRS - Provides report authors with an easy and powerful way to create choropleth and informative maps that are integrated with data. A perfect complement to any report that displays geographical data of any type.
Add interactive charts and maps to your apps and websites.
Map collection - Highcharts Maps includes a collection of maps, optimized for use with Highcharts Maps. For common maps, it saves you the trouble of finding or drawing suitable SVG or GeoJSON maps. Instead, you can choose between hundreds of pre-generated maps of countries, regions and other administration levels.
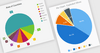
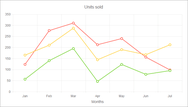
A pure JavaScript library for creating responsive, interactive charts for React apps.
Accessibility - Create interactive charts that empower people with disabilities. Users are able to navigate and interact with charts using the keyboard or voice input and they can use sonification to play back charts using sound.
A comprehensive, native Blazor UI components library.
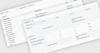
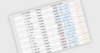
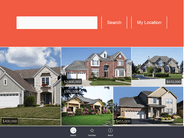
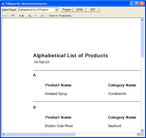
Fast & Powerful Grid Component - A feature-rich component useful for displaying data in a tabular format. Its wide range of functionalities include data binding, editing, Excel-like filtering, custom sorting, aggregating rows, selection and support for Excel, CSV and PDF formats.
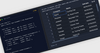
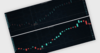
Create stock or general timeline charts for your Web and mobile apps.
Intelligent Datagrouping - With Highcharts Stock’s built-in data grouping facility, data is quickly grouped into optional groups like months or days, and displayed. When zooming in on smaller ranges, the grouping is redone and you can inspect the full resolution data.
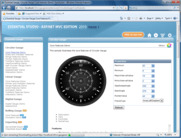
Diagramming components for dependency visualization and analysis.
Stable Auto Layout - To prevent multi-parent hierarchy diagrams changing dramatically each time a node is added/removed, rules can be set for ordering nodes relative to each other. Because they are soft rules it does not enforce the layout so the control can still choose the optimal layout.
Build Web Forms apps for any browser and device in half the time.
Seamless UX Across Devices - Telerik UI for ASP.NET AJAX controls look and work flawlessly across all major browsers: Internet Explorer 6+, Chrome 2+, Firefox 3.6+, Safari 4+ and Opera 10+.
Create simple, flexible and highly customizable organization charts.
Organization Charts - OrgChart JS is a powerful component that allows you to visualize nodes. It provides a variety of ways to manipulate the underlying data including node editing, navigation, expand/collapse, drag & drop and grouping.