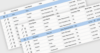
Data Visualization Components News

RSS Feed

Visualize Trends with Bar Charts

May 12, 2026Feature Highlight
Display business metrics with clear horizontal and vertical charts that help users identify patterns and performance changes.

Enable Cell Comments in Data Grids

May 11, 2026Product Update
Smart UI v26.0.0 adds native data grid cell comments for integrated collaboration, contextual feedback, and faster data reviews.

Visually Build Advanced Grid and TreeList Filters

May 8, 2026Product Update
DevExpress Blazor includes a built-in Filter Builder dialog that lets users create complex Grid and TreeList filters without writing additional code.

Visualize Data Variation with Range Charts

May 5, 2026Feature Highlight
Highlight value ranges with intuitive visuals that reveal patterns, making comparisons and trends clearer and easier to interpret at a glance.

Sort Data Across Multiple Columns in jQuery

May 5, 2026Feature Highlight
Organize and compare complex datasets efficiently in web applications by applying hierarchical sorting across multiple grid columns.

Transform Grid Data Analysis with Nested Grouping

May 1, 2026Product Update
FastGrid adds nested grouping with expand and collapse functionality to organize complex data into clear, multi-level hierarchies.

Create, Edit, and Customize JavaScript Data Tables

April 29, 2026Feature Highlight
Use Highcharts Grid Pro to give your JavaScript apps a complete interactive data experience.

Export Charts to PDF in jQuery

April 28, 2026Feature Highlight
Enable data visualization with PDF export capabilities in jQuery, allowing users to easily distribute charts as PDF files directly from the browser.

Display Hierarchies as Indented Lists

April 24, 2026Product Update
OrgChart JS provides a tree list layout that presents hierarchical data in a vertically aligned structure, making nested information easier to read.

Annotate Charts with Meaningful Context

April 24, 2026Feature Highlight
Enhance Vue.js data visualizations by embedding dynamic annotations that highlight key insights and support interactive analysis.

Connect Data Faster with Grid Hyperlinks

April 23, 2026Feature Highlight
Interactive grid links enable navigation to related content, improving user experience, increasing productivity, and helping users access information.

Easily Reorder Rows in WPF Grids

April 20, 2026Feature Highlight
.NET WPF grid controls let users change row display order directly, supporting custom sequencing and interactive data management.

Track Key Metrics with Real-Time Gauge Insights

April 17, 2026Feature Highlight
Present key data with gauge charts that clearly show current values and make it easy to spot changes and trends over time.

Build Interactive Maps with a Provider-Neutral Model

April 17, 2026Product Update
Blazorise 2.1 adds mapping tools with interactive components, dynamic markers, and full control over map behavior.

Organize Diagrams with Structured Categories

April 16, 2026Product Update
MindFusion.Diagramming for WinForms v7.2 adds a Palette control with categorized items for intuitive organization and faster diagram building.

Highlight Key Insights with Conditional Formatting

April 16, 2026Feature Highlight
Improve data visibility with conditional formatting in grids, using visual cues to surface important patterns and anomalies.

Accelerate Development with Angular 21

April 10, 2026Product Update
Wijmo 2026 v1 supports Angular 21 with integrated components that speed up development and unlock advanced capabilities.

Prevent Unwanted Grid Edits

April 9, 2026Feature Highlight
JavaScript grids with read-only columns help developers safeguard fixed values while making editing rules clearer across the interface.

Use Renko Charts to Highlight Clear Trends

April 7, 2026Feature Highlight
Focus on meaningful price movement using brick-based visuals that reduce noise, making trends, and key levels easier to interpret.

Predict Future Outcomes with Trend Analysis

April 2, 2026Product Update
Syncfusion Essential Studio 2026 Volume 1 adds chart trendline support in MAUI apps, helping uncover patterns and visualize data direction.