Format Data Grids as Cards in .NET Applications
August 28, 2025Feature Highlight
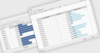
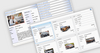
Using card view lets developers display grid data in a structured visual layout, improving readability and user engagement.
Tel: (888) 850 9911
Fax: +1 770 250 6199