Handle Large Datasets with Advanced Data Grid
April 9, 2025Product Update
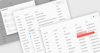
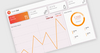
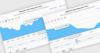
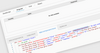
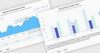
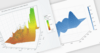
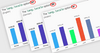
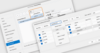
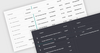
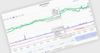
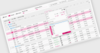
Infragistics Professional includes a high-performance Angular Data Grid designed for scalable, real-time interaction with huge datasets.
Tel: (888) 850 9911
Fax: +1 770 250 6199