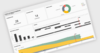
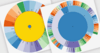
Data Visualization Components News

RSS Feed

Build Your UI in React and Blazor with AI Assistance

June 13, 2025Product Update
The 2025 Q2 releases for KendoReact and Telerik UI for Blazor add built-in AI coding assistants to help produce high quality code with ease.

Keep Grid Headers Visible While Scrolling

June 12, 2025Feature Highlight
Maintain column context in large datasets by fixing header rows at the top of the grid during vertical scrolling.

Improve Grid Usability on Mobile Devices

June 12, 2025Product Update
Kendo UI 2025 Q2 now includes a fully adaptive Grid, improving usability with enhanced editing, responsive forms and intuitive navigation.

Add Flexible Side Panels to Your Grids

June 11, 2025Product Update
jQWidgets v23.0.0 adds a new side panel in jqxGrid, enabling you to display supplementary data or controls alongside your grid.

Gain Clearer Data Insights with Radial Column Charts

June 10, 2025Product Update
ComponentOne Studio WinForms 2025 v1 introduces stacked column chart support in radar plots, ideal for multivariate comparisons.

Quadbase Systems Joins ComponentSource

June 10, 2025Feature Highlight
ComponentSource partners with Quadbase Systems to provide developers with tools for reporting, data visualization, and dashboards.

Visualize Trends Over Time with Line Charts

June 6, 2025Feature Highlight
Line charts deliver a view of metric progression, allowing multi-series comparisons, identification of shifts, and strategic forecasting.

Build Cross-Platform UIs with .NET 9 Support

June 5, 2025Product Update
Nevron Open Vision for .NET 2025.1 adds support for .NET 9, providing enhanced performance, security, and cross-platform consistency.

Develop Angular Apps with Pre-Built UI Controls

June 5, 2025Feature Highlight
Angular UI suites provide a comprehensive set of components that reduce development time and ensure consistency across complex web apps.

Refine Grid Data with Smarter Filtering

June 4, 2025Product Update
ComponentOne Studio Enterprise 2025 v1 adds a modernized column filter UI to FlexGrid, supporting more advanced and precise filtering.

Visualize Massive Datasets with Zero Lag

June 3, 2025Product Update
NOV Chart for .NET 2025.1 adds GPU-accelerated Fast Bar, Fast Line and Fast Point series to render millions of data points in real time.

Add Precision to Time-Based Data

June 2, 2025Product Update
LightningChart JS v7.1 brings nanosecond-level precision to time-based charts, enabling ultra-detailed analysis of high-frequency temporal data.

Ensure Accessibility and Data Clarity for All Users

June 2, 2025Feature Highlight
Comply with WCAG standards and deliver clear, accessible information through intuitive JavaScript charts.

Celebrating 3 Year Partnership with Blazorise

June 2, 2025Publisher Milestone
ComponentSource and Blazorise have worked together since 2022 to provide developers with high-performance Blazor UI components.

Customize Data Entry and Display

June 2, 2025Product Update
Studio Controls for COM/COM 64 v7.5 adds a new ctxGrid control for high-speed data presentation and advanced input handling.

Deliver Instant Insights with Aggregated Data

May 27, 2025Feature Highlight
Aggregation features in React grid components allow users to quickly view key metrics, such as sums and averages, directly within the grid interface.

Visualize Key Data In Vue.js Reports

May 22, 2025Feature Highlight
Incorporating charts in reports transforms raw data into clear, engaging visuals that highlight key metrics for more informed decision-making.

Access Live Chart Data Through JavaScript APIs

May 22, 2025Feature Highlight
React chart controls can retrieve up-to-date data on demand by integrating with custom JavaScript APIs for dynamic visual displays.

Explore Powerful AI-driven Features in your JavaScript Spreadsheets

May 22, 2025Feature Highlight
SpreadJS 18.1 includes a developer preview of AI Features for Natural Language and Smart Analysis.

Bunifu Technologies Adds .NET 9 Support

May 19, 2025Publisher Update
The Bunifu product range can now be used to integrate modern user interface and charting components in the Microsoft .NET 9.0 ecosystem.