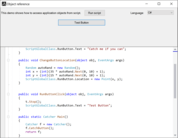
Presentation layer components implement the functionality required to allow users to interact with the application. This layer includes user interface components and UI controls as well as presentation logic components that process and manage the user interaction.
Everything you need to build modern, beautiful, responsive apps.
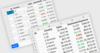
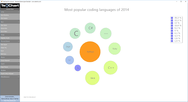
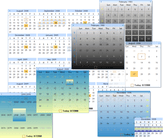
Modern UI Components - Kendo UI's 100+ components handle everything you need to satisfy your business requirements. Add advanced components such as data grids, charts, schedulers, and calendars with just a few lines of code.
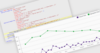
Easily Generate Rich Charts - Actipro Charts supports many chart types from basic line and bar charts to complex stacked area charts. It includes useful features such as multiple series, labels, legends, stacking, and customizable palettes.
High-performance toolkits for your development projects.
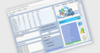
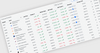
WinUI DataGrid - Used for efficiently displaying and manipulating tabular data, its rich feature set includes data binding, editing, sorting, filtering, grouping and data virtualization. It has been optimized for working with millions of records, as well as handling high-frequency, real-time updates.
All Telerik .NET tools & Kendo UI JavaScript components in one package.
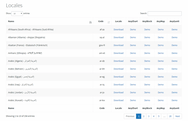
Powerful Report Management - Use Telerik Report Server as a standalone report management solution or integrate it easily with your application. Powered by Telerik Reporting.
Includes over 600 UI Controls, DevExpress Dashboard, eXpressApp Framework and more.
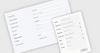
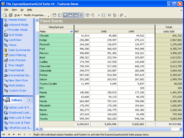
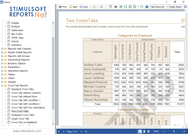
Reporting for .NET - DevExpress Reporting delivers easy-to-use customization options and a rich set of report controls, including multi-dimensional pivot tables & charts so you can build reports of unmatched informational clarity.
Deliver amazing user experiences on the WinForms platform.
Diagram Designer - Allow your end-users to create and display diagrams of various types and styles. The users can also modify existing diagrams, save diagrams to numerous file formats and load previously saved diagrams.
JavaScript component suite for responsive Web development.
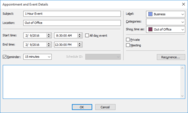
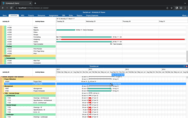
JavaScript Scheduling - DevExtreme Scheduler is a versatile scheduling/calendar component for jQuery, Angular, React, and Vue. It includes built-in appointment editing and time zone support. DevExtreme Scheduler ships with day, week, month, agenda, timeline, and agenda views.
Build applications for Windows, Web, mobile and tablet.
Customizable Empty Points - The Chart Control can now process gaps (within a data source) as empty points. The appearance of these gaps can be customized with different style options. You can change the appearance of point markers, line, and area segments.
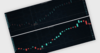
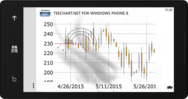
Interactive Charts & Graphs - Visualize and analyze data with 30+ charts and graphs ranging from line to financial charts. Users can interact and explore with features such as zoom and pan, selection, tooltip and trackball.