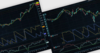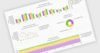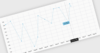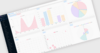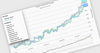
Add Indicators to Highlight Trends in Blazor Charts
December 10, 2025Feature Highlight
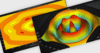
Enhance data interpretation by overlaying calculated trends and thresholds directly onto your visualizations.
Tel: (888) 850 9911
Fax: +1 770 250 6199