Data visualization components implement the functionality to view data in tables or data grids, as simple charts or complex graphs and enables you to create sophisticated management dashboards using gauges, maps and flowcharts.
Advanced data visualization for more informative reports.
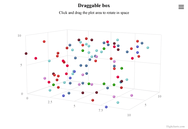
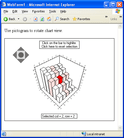
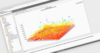
Nevron Chart for SSRS - Delivers a complete set of 2D and 3D chart types, customizable axes, data integration and visual effects to your reports. An indispensable tool for any Business Intelligence, scorecard or scientific report.
Add interactive charts and maps to your apps and websites.
Map collection - Highcharts Maps includes a collection of maps, optimized for use with Highcharts Maps. For common maps, it saves you the trouble of finding or drawing suitable SVG or GeoJSON maps. Instead, you can choose between hundreds of pre-generated maps of countries, regions and other administration levels.
JavaScript charts designed to be embedded and integrated.
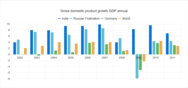
Wide Variety of Chart Types - AnyChart allows you to display 68 out-of-the-box chart types (Area, Bar, Bar Mekko, Box, Bubble, Bullet, Candlestick, Cherry, Circular, Column, Dot/Marker, Doughnut, etc.) and provides features to create your own.
.
Stunning JavaScript charts for your website or Web application.
Mapping - Easily add interactive maps for all countries, states and provinces in the world to your applications. JSMapping features real-time animation, zooming and panning, advanced thematic mapping, map overlays, and support for dynamic loading.
.
Every map type you need - Highcharts Maps includes a wide range of vector-based map types including map area, map line, points of interest, bubbles on maps and heatmaps.
Add financial, scientific, engineering and business charts to your applications.
Scientific Graph - Pass large amounts of data into the graph and easily view the information in smaller/clearer increments via zooming or dialog adjustments. Zooming can be invoked by left-button dragging a zoom box.
A pure JavaScript library for creating responsive, interactive charts for React apps.
Dynamic and Customizable - The elegant charts render crisp and clear at any resolution and are easily styled using JavaScript or CSS. Highcharts is also extendable and pluggable for experts seeking advanced animations and functionality.
Adaptive UI for building Windows 10 apps with one code base.
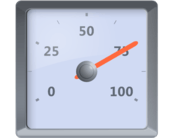
UWP Gauge - The UWP Gauge control helps you build business dashboards or craft graphical indicators. It includes a rich assortment of circular, linear and numeric gauge types and offers powerful customization.
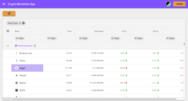
Blazor Components Library - 65+ UI and data visualization components including DataGrid (editing, grouping and Excel-like filtering), Charts (30+ charts and graphs ranging from line to financial charts) and Scheduler (display multiple calendars in a single layout with finely grouped events).
.













 (2)
(2)
 (2)
(2)





 (68)
(68)

 (2)
(2)