Tires ComparedJavaScript line chart with custom marker chart symbols, ranged tick support with colour ranged and legend entry icons along with source footer text chart customizations.
ColumnJavaScript column chart with ranged values including start stop with custom complete fill, superscript and symbol support custom axis and date handling and header font and title customization.
Calendar Vertical YearJavaScript vertical calendar chart with custom smart palette legend indicator, custom legend box ranges, heat map charts, inline vertical and horizontal gauge Sparkline gauge charts.
Bar MekkoJavaScript mekko chart showing variwide bar charts, custom labeling with ranged ticks and arrow customization, custom ticks with subscripts and a modern minimal chart design.
Pie DonutJavaScript pie chart and two variable pie charts with custom SVG icons, colour transparency, advanced labeling with series and element colour matched lines and label dot markers dual data pie shows multiple values per slice by varying slice length and slice width.
Water Heating CurveAn advanced JavaScript line chart shows off ranged axis ticks nested, custom axis and shaded chart areas for custom chart grid lines as well as a chart annotation with symbols. Also demonstrated is full super script, subscript and font support in this resolution independent SVG and HTML output using JavaScript charting.
CombinationThis JavaScript combination chart shows off a modern design with stacked bar charts, lines charts, negative value support, ranged axis markers, custom ticks, legend above chart as a title, custom quarters axis labels, and simplified chart area formatting for a modern visual look mobile friendly using SVG output via JavaScript and HTML5.
CalendarJavaScript Calendar charts are included with JSCharting at no additional charge including full large scale month view charts supporting inline Sparkline charts, custom SVG icons, small popup calendar support with inline heatmap charts, date selector calendar controls, vertical and horizontal condensed calendar chart views and much more all rendered with HTML5 and SVG via JavaScript for resolution independent and scalable output ideally suited for modern web applications.
StockJavaScript Stock charts are included with JSCharting at no additional charge including candle stick finance charts, high/low charts, line stock charts and high/low/open/close candles with custom tooltips. Easily customize news items or additional markers, lines, tends or technical stock analysis all rendered automatically for modern web applications using resolution independent and mobile friendly SVG output via JavaScript and HTML5.
GridJavaScript Grids are seamlessly integrated with JSCharting which enables you to automatically generate and display grid views from an existing chart without additional coding. In addition micro charts and spark lines can be seamlessly rendered inline within grids along with resolution independent SVG icons. Grids render with native JavaScript and HTML5 allowing high resolution output and responsive designs in your projects.
MicroChartsJavaScript Micro charts (aka Sparkline) are ideal for dashboards but also seamlessly integrate into larger charts as shown here in the calendar chart and organizational chart. Also shown is micro chart usage in a tooltip for an area line chart. All JSC micro charts are resolution independent and mobile friendly using SVG output via JavaScript and HTML5.
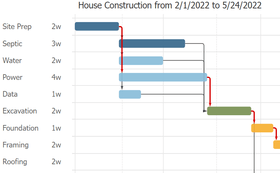
Gantt GroupJavaScript Gantt charts are included with each JSCharting license without a separate product purchase and include Gantt dependencies, Gantt markers, Gantt dependencies, custom grid listings, custom arrows, markers and icons all resolution independent and mobile friendly SVG output via JavaScript and HTML5.
Mapping GroupJavaScript Mapping charts are included with each JSCharting license without a separate product purchase and include detailed maps for all countries in the world. JS mapping supports bubble thematic maps, choropleth maps, projections and more with resolution independent and mobile friendly SVG output via JavaScript and HTML5.
Axis Tick Icons
Axis Marker Calendar Pattern
Bubble
Calendar Lunar
Calendars in Dashbaords
Cars in Use
Chart Grid
Circular Gauges
Circular Wind
Classic Gauges
Column Pyramid
Datagrid
Dual Axis
Finance
Funnels
Gantt
Gantt Complex
Gauge Linear
Grid Calendar
Heatmap
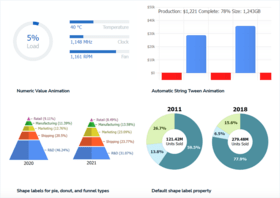
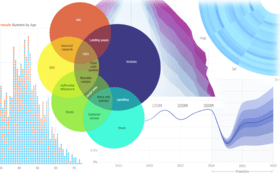
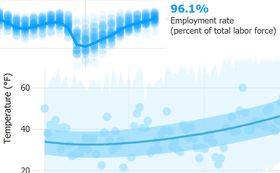
Infographics
Legend Axis Markers
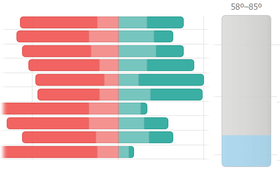
Linear Bars
Lines CSV
Line Type
Map Bubble
Map LLC
Mapping States
Map Thematic Sales
New Cars
Markers
Micro Tooltip
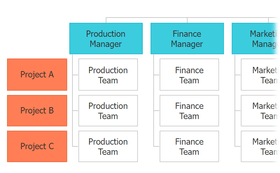
OrganizationalJavaScript Org chart with inline Sparkline gauge charts showing employee characteristics.
OrganizationalJavaScript organizational chart with custom images, bullet list typographic layout and custom formatted text headers. JSCharting org charts are included at no additional charge and support custom layouts and line linking automatically in the different layout views.
RadarJavaScript radar charts with completed hatching for disabled and colorblind viewers, custom axis, start and stop areas, polar chart renderings, advanced chart axis labeling and more.
Polar ChartsJavaScript polar charts with custom axis, start and stop areas, 180 degree radar renderings, warning axis markers, advanced chart axis labeling and more.