Identify and eliminate the root causes of slow application startups.
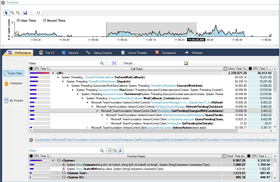
Instrumentation ProfilerLow overhead profiling with ultra-fast profiler engine and selective instrumentation.
Simplify ComplexitySignificantly reduce your analysis time by removing irrelevant information using rich filter functionality to stay focused.
Compare Snapshots (Performance Instrumentation Profiler)Investigate the cause of sluggish scenario performance by comparing bad runs vs. good runs or the impact of code changes.
Memory overview to get the big pictureThe overview provides you with a complete breakdown of all contributors for memory consumption.
Managed HeapThe Managed Heap view shows memory statistics about all managed objects which are present at the time of the snapshot.
GDI Resource TrackingThe GDI Tacker view shows the list of GDI handles (brushes, pens, fonts, bitmaps, and others) opened by the process including its allocation stacks.
Win32 Allocation TrackingTracking of memory and resource issues triggered from native code including the .NET runtime.
File I/O and Pipe - Tracing with Data CaptureView .NET Remoting / WCF calls. View performed read/write operations with actual data read/written.
Network Events - Tracing with Data CaptureShows all operations with time stamps, operation type, length, duration, data sent or received, local and remote address.
RegistryShows registry activities that were captured from the target process.
Windows EventsReview the window operations for instance to analyze cross-thread operation exceptions.
Single ExceptionFind the source code lines which caused exceptions.
Exception Profiling - By Stack-Back-TracesGet known to trigger frequency and timely distribution of exception stacks or exception types.
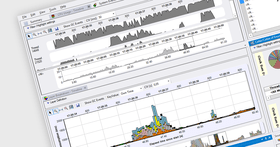
Sampling Profiler, CPU and Clock TimesSimultaneously capture CPU- and waiting induced time losses.
Sampling Profiler: Hotspot TimelineTimely distribution of CPU burners and wait blocking.