Components / JavaScript / HTML5 / Vizuly / DlhSoft

  1. $$$$ | Buy

    Screenshots: 0 ... Read more

  2. $$ | Buy

    Description: Kanban board component for JavaScript. DlhSoft Kanban Library is a component that helps you create a Kanban board user interface with horizontal and vertical drag & drop support. You can display as many rows and columns as needed and each cell is ... Read more

  3. $$ | Buy

    Description: Calendar, date picker, time picker, multi-selector combo box, toggle button and tree-grid components for JavaScript. DlhSoft Hyper Library includes JavaScript components that provide a user interface for displaying and selecting dates and times as well as ... Read more

  4. $$$$$ | Buy

    Description: Gantt, Schedule, Load, and PERT Chart components with rich user experience, customizable appearance and behavior, high performance, and printing. DlhSoft Gantt Chart Bundle includes Gantt Chart Light Library for WPF, Gantt Chart Hyper Library for HTML5 ... Read more

  5. $$$ | Buy

    Release Notes: Improved multiple default settings, especially targeting component appearance. ... Read more

  6. $$ | Buy

    Release Notes: Improved multiple default settings, especially targeting component appearance. ... Read more

  7. $$$ | Buy

    Description: Add charts and visualizations to your JavaScript apps. Vizuly Professional includes Corona, Halo, Radial Bar, Ring Chart, Weighted Tree, Geo Plot, Bar Chart, Column Chart, Line Area Chart, Radar Chart, Radial Progress, Scatter Plot, Sunburst, Tree Map, ... Read more

  8. $ | Buy

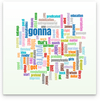
    Description: Add Word Clouds to your JavaScript apps. Vizuly Word Cloud is a unique way to represent the occurrence rate of words within a given text stream. This visualization supports an exclusion list that will ignore common pronouns, profanity, or any words you ... Read more

  9. $ | Buy

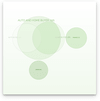
    Description: Add Venn Diagram charts to your JavaScript apps. Vizuly Venn Diagram shows all possible logical relations between a finite collection of different sets. This chart depicts elements as points in the plane, and sets as regions inside closed curves. A Venn ... Read more

  10. Vizuly Tree Map Buy Now

    Brand: Vizuly
    Primary Category: Chart Components
    $ | Buy

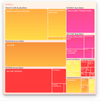
    Description: Add Tree Map charts to your JavaScript apps. Vizuly Tree Map visualizes hierarchical data in nested rectangular plots where the area of each rectangle is bound to a data property you can set. This TreeMap also supports the ability to drill down/up, in ... Read more