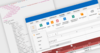
Extract Text from PDF Documents
June 22, 2026Feature Highlight
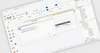
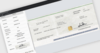
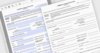
Provide a convenient way to capture and reuse information by enabling users to select and copy text directly in the PDF viewer in Blazor apps.
Tel: (888) 850 9911
Fax: +1 770 250 6199