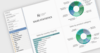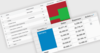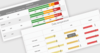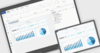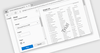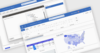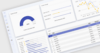
Create a Dynamic Dashboard in React
November 5, 2024Feature Highlight
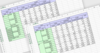
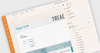
Wijmo by MESCIUS enables you to create customizable, interactive dashboards for personalized, data-rich visualizations.
Tel: (888) 850 9911
Fax: +1 770 250 6199