Enhance Engagement with Smooth Data Transitions
September 23, 2024Product Update
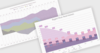
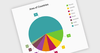
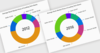
Syncfusion Essential Studio JavaScript 2024 Vol 3 allows users to update, add, or remove chart data with animations, enhancing engagement.
Tel: (888) 850 9911
Fax: +1 770 250 6199