Presentation Layer Components News

RSS Feed

Transform PDF Editing with WebAssembly Viewer

August 23, 2024Product Update
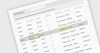
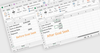
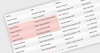
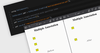
Document Solutions for PDF 7.2 offers users a seamless cross-platform PDF editing experience with cutting-edge Wasm-powered technology.

Deliver Essential Messages Effectively

August 23, 2024Product Update
Ignite UI for Web Components 24.1 adds a Banner component to create alerts that command attention without disrupting the user experience.

Disable Filtering When Searching Grids in WPF

August 23, 2024Product Update
Telerik UI for WPF 2024 Q3 adds the flexibility to disable data filtering during grid searches, enabling more customizable search options.

Refine Excel Analysis with Automated Goal Seeking

August 23, 2024Product Update
Document Solutions for Excel, .NET 7.2 can now automate scenario analysis and decision making within your .NET applications.

Enhance Blazor Grid Apps with Multiple Cell Selection

August 22, 2024Product Update
Telerik UI for Blazor v6.1.0 (2024 Q3) adds a new feature to the grid component which grants greater flexibility in cell selection and navigation.

Uncover Insights Faster with Chart Data Grouping

August 22, 2024Product Update
Infragistics Ultimate UI for Windows Forms 24.1 helps users organize and categorize complex chart data with advanced data grouping features.

Remove PDF Annotations in .NET 8

August 21, 2024Feature Highlight
Enhance .NET 8 applications with the ability to remove annotations from PDF documents, making files clean and professional, ready for distribution.

Create Shareable PDF Reports in Seconds

August 20, 2024Feature Highlight
Export high-quality, customizable PDF Reports to effectively communicate your data and insights to your clients, stakeholders, or team members.

Display Visual Representations of Data or Processes

August 20, 2024Feature Highlight
.NET WinForms diagram controls let you easily build complex diagrams, flowcharts, organizational charts, and other visual representations.

Optimize Data Collection with PDF Form Submission

August 20, 2024Feature Highlight
Submit actions allow applications to send PDF form data to a predefined location, streamlining data collection and processing.

Enhance Data Organization with Tables

August 20, 2024Feature Highlight
Tables in spreadsheets provide a structured way to organize data, enhance data integrity, and enable efficient analysis and reporting.

Visualize a Hierarchical Data Series in ASP.NET AJAX

August 20, 2024Product Update
Telerik UI for ASP.NET AJAX 2024 Q3 adds the pyramid chart type, enabling developers to illustrate hierarchical data structures in their web apps.

Uncover Deeper Insights With a Hierarchical Grid

August 19, 2024Product Update
Infragistics Ignite UI 24.1 helps users navigate complex data effortlessly with a new solution offering expandable and collapsible views in React.

Let Users Manage Dates, Events, and Schedules

August 19, 2024Feature Highlight
User Interface suites that include calendar components make it easy to incorporate date and time functionalities into your application.

Interact with Specific Rows within React Grids

August 16, 2024Feature Highlight
Row selection functionality enables users to easily select one or multiple rows to perform subsequent actions on the selected data.

Visualize Hierarchical Data with Unrivaled Flexibility

August 16, 2024Product Update
Infragistics Ignite UI for Angular 24.1 allows you to explore your pivot data in a new dimension with innovative horizontal layout option.

Leverage SSO Authentication in Report Management

August 16, 2024Product Update
Telerik Report Server 2024 Q3 adds support for Microsoft Entra ID authentication, providing single sign-on functionality for .NET.

Create a C# .NET Pyramid Chart with FlexChart

August 16, 2024Feature Highlight
Learn how to leverage ComponentOne FlexChart by MESCIUS to display hierarchical data in a visually engaging pyramid-style visualization.

Consolidate External Files into Your PDFs

August 15, 2024Feature Highlight
WinForms PDF components with support for attachments allow you to centralize information for a more efficient, streamlined workflow.

Visualize Patterns and Gradual Changes

August 15, 2024Feature Highlight
Spline charts offer a visually appealing and intuitive representation of trends and are commonly used in fields like finance and engineering.