Presentation Layer Components News

RSS Feed

Add Interactivity to PDFs with Hyperlink Navigation

February 23, 2024Feature Highlight
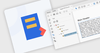
Enable users to navigate within PDF documents or to external websites and files by clicking on embedded hyperlinks.

Improve Document Accessibility in Your Node.js Apps

February 23, 2024Product Update
GroupDocs.Conversion for Node.js via Java V24.2 can now convert tagged DOCX files to tagged PDF, ensuring information integrity across formats.

Add Drill-Through Charts to Your Web Application

February 23, 2024Feature Highlight
JavaScript drill-through charts empower users to easily navigate multiple layers of data and hone in on specific data points.

Increase Data Density with the rMQR Symbology

February 22, 2024Product Update
Aspose.BarCode for Python via .NET V24.1 adds support for Rectangular Micro QR codes, allowing you greater flexibility in data encoding.

Create and Edit Report Layouts within Visual Studio

February 22, 2024Feature Highlight
Visual Studio integrated report designers offer seamless reporting solutions for your .NET WinForms projects.

Highlight Trends with React Spreadsheet Sparklines

February 22, 2024Feature Highlight
Embed compact charts within spreadsheet cells to visually highlight essential insights and simplify data interpretation.

Refine Data Exploration with Range Trackbars

February 22, 2024Feature Highlight
Adding a range trackbar to your Blazor app allows users to select the start and endpoints of a range of data, making interactive filtering easier.

Implement Server Side Sorting for Angular Grids

February 21, 2024Feature Highlight
Unlock the potential of Angular grids with efficient server-side sorting, optimizing performance and scalability for seamless data handling.

Consolidate PDFs Into a Single, Organized Document

February 21, 2024Feature Highlight
PDF merging streamlines workflows, organizes related information, and empowers dynamic document creation for enhanced user experiences.

Annotate Charts to Enhance Visual Insights

February 21, 2024Feature Highlight
Leverage annotations for precision and clarity, transforming your .NET WPF charts into powerful data storytelling tools.

Craft Dynamic 2D Graphics and Text in Your Java Apps

February 21, 2024Product Update
Aspose.Drawing for Java provides developers with an extensive toolkit for drawing lines, shapes, and text with advanced formatting options.

Make Your Reports Accessible by Converting to HTML

February 20, 2024Feature Highlight
Exporting reports to the HTML format transforms them into convenient web pages, making them available to anyone with a web browser.

Depict Hierarchical Relationships Between Concepts

February 20, 2024Feature Highlight
Pyramid charts enable you to visualize complex hierarchical relationships and convey overall trends in a clear and concise way.

Navigate Large Spreadsheets Without Losing Context

February 20, 2024Feature Highlight
Adding freeze pane support to your spreadsheets allows users to scroll through extensive data whilst keeping crucial reference points in view.

Optimize Chart Text Rendering at High DPI

February 19, 2024Product Update
LightningChart .NET v11.0.1.1 delivers sharp text across all screen resolutions, ensuring your charts look stunning on any display.

Add a .NET Spreadsheet Ribbon Bar using C#

February 19, 2024Feature Highlight
Boost user productivity and enhance your .NET app's UI with an Excel-like ribbon that offers contextual behaviors, command execution, and more.

Supercharge Your Data Grid with Easy CRUD Actions

February 19, 2024Feature Highlight
Leverage the new DevExpress Blazor Grid toolbar section for intuitive Create, Read, Update, and Delete functionality.

Boost PDF Security and Branding with Watermarks

February 19, 2024Feature Highlight
Stamp PDF documents with a text or image watermark to protect against plagiarism and reinforce your brand identity.

Enhance Your WinForms Reports with Themes

February 16, 2024Feature Highlight
Reporting controls with theming support transform reports into visually appealing documents that reinforce your brand identity.

Render Complex 3D Geometries in JavaScript

February 16, 2024Product Update
LightningChart JS v5.1.0 adds a new Mesh Model chart type for colorful, high-performance visualizations of 3D objects using vertex values.