Export Reports to CSV in Blazor
May 12, 2026Feature Highlight
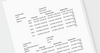
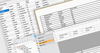
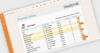
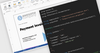
Produce CSV files from report data in Blazor applications with CSV export functionality, simplifying data exchange across platforms.
Tel: (888) 850 9911
Fax: +1 770 250 6199