








Official Supplier
As official and authorized distributors, we supply you with legitimate licenses directly from 200+ software publishers.
See all our Brands.
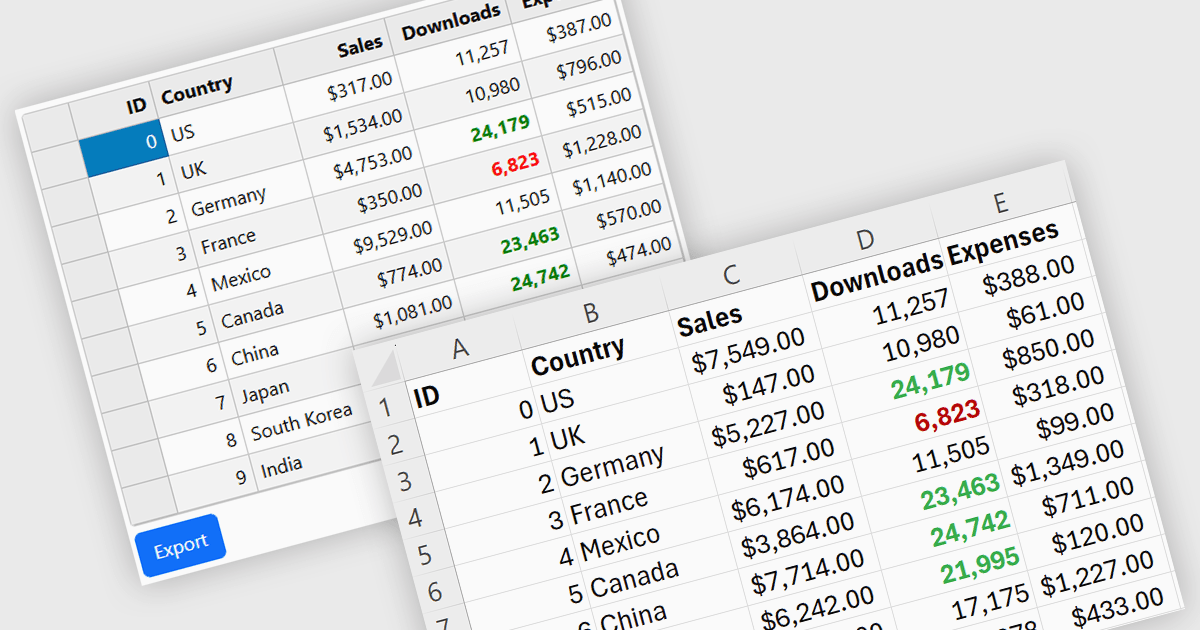
Exporting grid data to XLS/XLSX enables users to save data in Microsoft Excel-compatible formats for editing, analysis, reporting, and sharing. Common use cases include creating business reports, analyzing sales or financial data, sharing information with stakeholders, and preparing datasets for further processing.
Several Angular grid controls offer the ability to export grids to Excel including:
For an in-depth analysis of features and price, visit our Angular grid controls comparison.
Wijmo by MESCIUS is a comprehensive JavaScript library offering a suite of high-performance UI components and data grids specifically designed to streamline the development of modern enterprise applications. It emphasizes reduced development time and improved maintainability, along with a focus on performance through its efficient design and small module size. Wijmo integrates seamlessly with popular JavaScript frameworks like Angular, React, and Vue.js, and supports cutting-edge technologies like TypeScript, making it a versatile solution for building complex web applications.
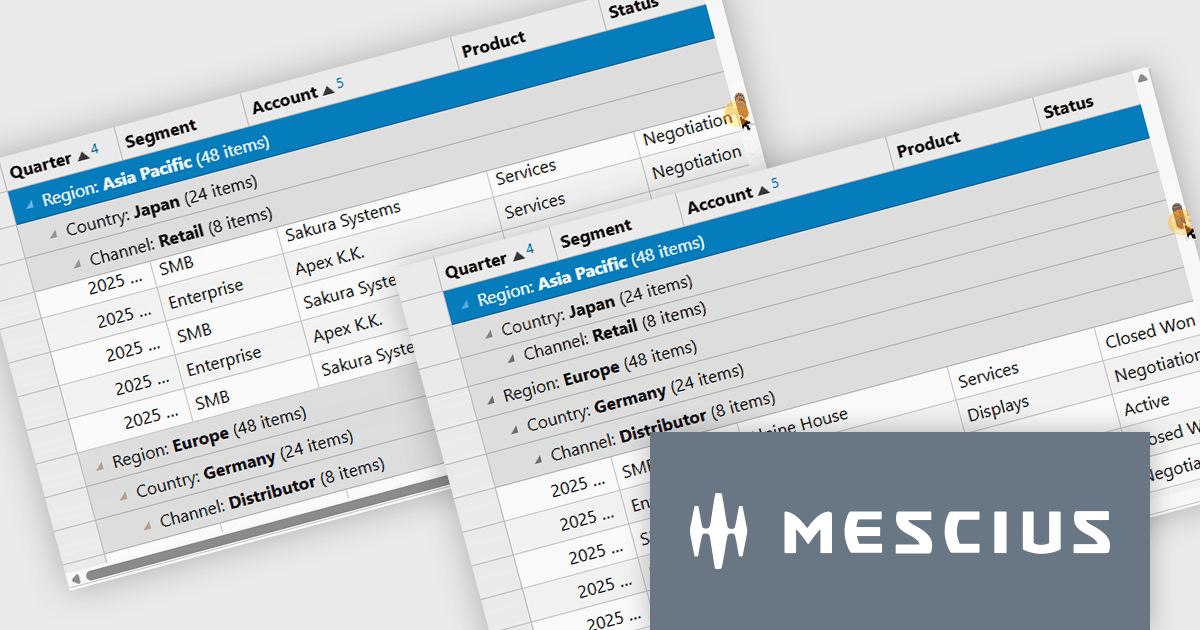
The Wijmo Build 5.20261.52 update introduces Sticky Group Headers for FlexGrid, allowing the current group header to remain visible while users scroll through grouped data. This enhancement helps developers create more intuitive data exploration experiences by improving navigation, readability, and user orientation when working with large grouped datasets. By keeping important group information accessible during scrolling, users can more easily understand their position within complex data views and work more efficiently without losing context.
To see a full list of what's new in 2026 v1 Build 5.20261.52, see our release notes.
Wijmo is licensed per developer. Developer Licenses are perpetual and include 1 year Subscription which provides upgrades, including bug fixes and new features. See our Wijmo licensing page for full details.
Learn more on our Wijmo product page.
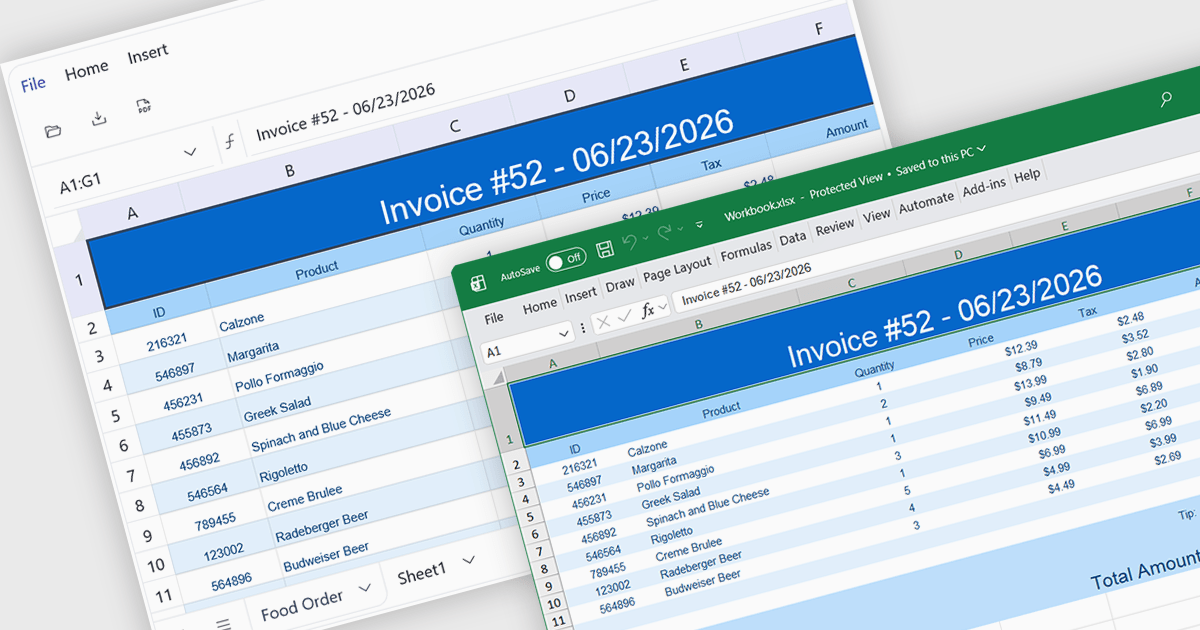
Exporting to XLSX in a spreadsheet component is the ability to generate Microsoft Excel Open XML Spreadsheet (.xlsx) files directly from application data or the current spreadsheet state, allowing users to save, share, and open content in Microsoft Excel and other compatible spreadsheet applications. For software developers, this provides a reliable way to deliver data in a widely supported format while preserving features such as worksheets, formulas, formatting, tables, and cell styles where supported, making it easier to integrate reporting, data exchange, and offline analysis into applications without requiring users to manually recreate or copy spreadsheet content.
Several Angular spreadsheet controls offer support exporting to XLSX including:
For an in-depth analysis of features and price, visit our Angular spreadsheet controls comparison.
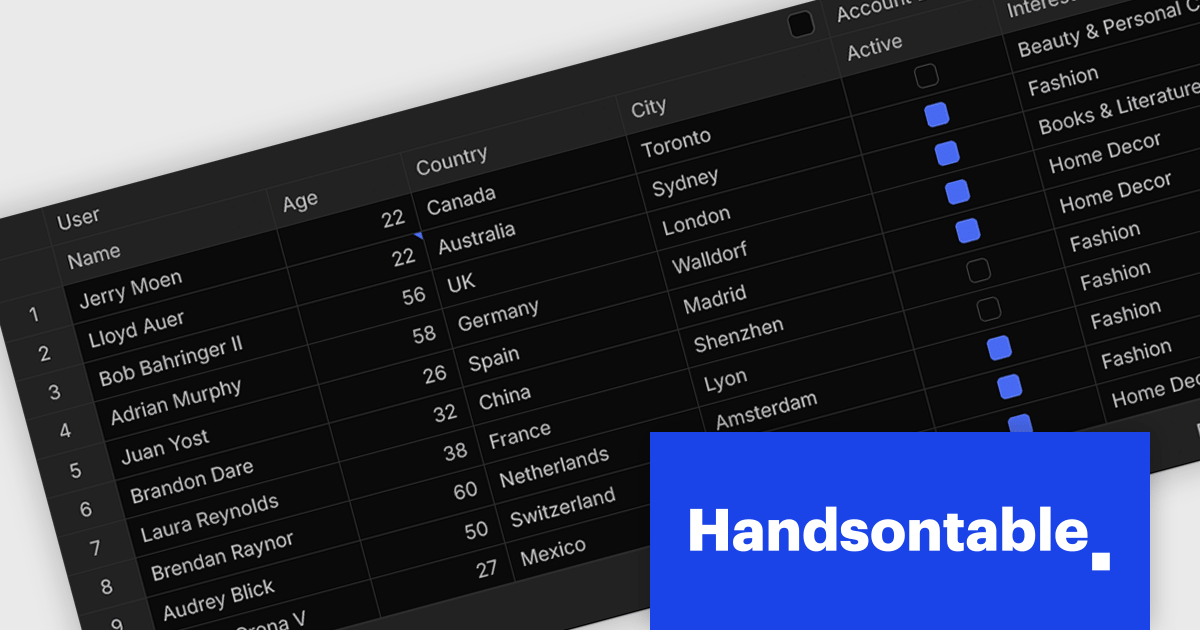
Handsontable is a JavaScript library designed to help developers build interactive data grids into their web applications. Offering a familiar spreadsheet-like interface, it allows users to edit, sort, and filter data with ease. Highly customizable and compatible with popular frameworks like React and Angular, Handsontable empowers developers to build robust data manipulation features into their web applications.
The Handsontable 18.0.0 release introduces a complete rewrite of its core from JavaScript to TypeScript. Although largely invisible in day-to-day use, this investment strengthens the foundation of the project, making the codebase easier to maintain, reducing the likelihood of defects, and providing developers with improved type safety and tooling. It lays the groundwork for future enhancements while helping ensure a more reliable experience for everyone building with Handsontable.
To see a full list of what's new in version 18.0.0, see our release notes.
Handsontable is licensed per developer and is available as an Annual or Perpetual license with 1 year support and maintenance. See our Handsontable licensing page for full details.
For more information, visit our Handsontable product page.
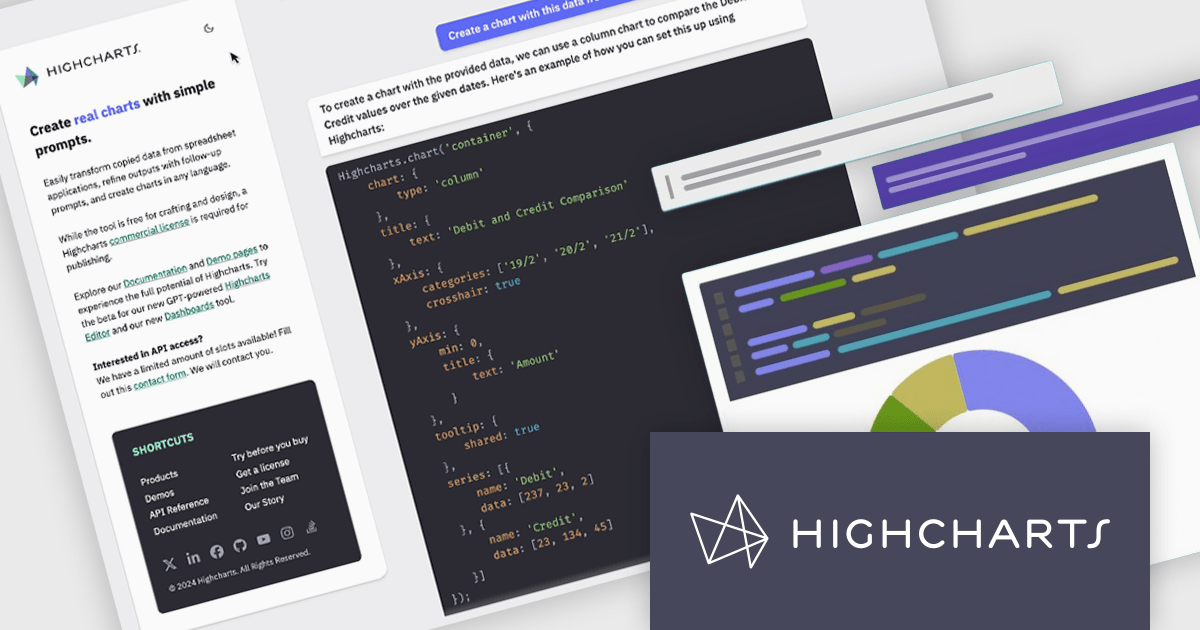
Highcharts is a JavaScript charting framework that allows web developers and data analysts to generate dynamic, visually appealing charts and graphs for websites and web applications. It can display a variety of chart types, including line, spline, area, column, bar, pie, scatter, and many more. Highcharts is well-known for its ease of use, rich documentation, and ability to handle huge datasets efficiently. Features include responsive design, accessibility support, and cross-browser compatibility. Its customization capabilities allow users to create bespoke data visualizations that increase engagement and provide insightful data presentations.
Highcharts GPT has been renamed Highcharts Assist to represent its evolution from an AI assistant associated with a single language model to a universal assistant for the Highcharts platform. Highcharts Assist provides software developers with support across implementation, debugging, licensing, product guidance, and best practices, while its model-agnostic approach allows the underlying AI technology to evolve over time without changing the user experience.
Highcharts Core is licensed on an annual or perpetual basis, OEM licenses, and Advantage Renewals. It is licensed per Developer and has several license options including Internal, SaaS, SaaS+, and Self Hosted. See our Highcharts Core licensing page for full details.
Learn more on our Highcharts Core product page.





Tel: (888) 850 9911
Fax: +1 770 250 6199


