


Official Supplier
As official and authorized distributors, we supply you with legitimate licenses directly from 200+ software publishers.
See all our Brands.
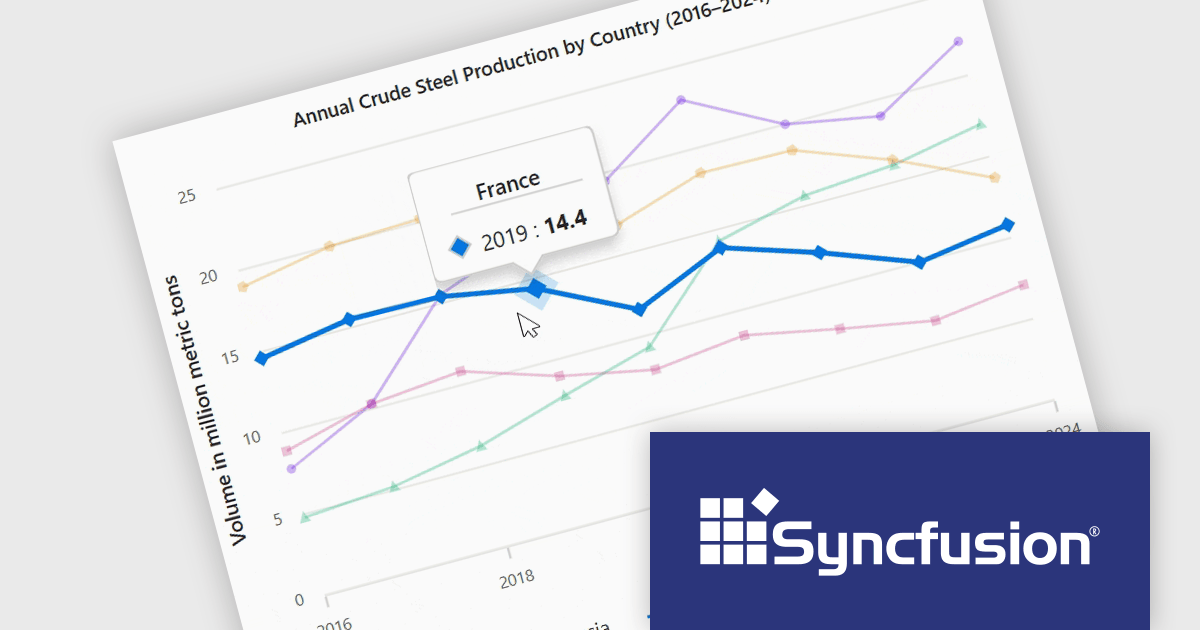
Syncfusion Essential Studio ASP.NET Core (available as part of Syncfusion Essential Studio Enterprise) empowers developers with a comprehensive suite of over 80 enterprise-grade UI components specifically designed for building modern and highly functional web applications. Leveraging the latest advancements in ASP.NET Core, it offers exceptional performance and scalability, streamlining development by eliminating the need for extensive custom coding. From data visualization tools like interactive charts and grids to sophisticated navigation elements and responsive layouts, Essential Studio equips developers with the building blocks to create rich user experiences, improve application efficiency, and accelerate time-to-market.
The Syncfusion Essential Studio ASP.NET Core 2025 Volume 1 release improves the chart component by adding tooltip functionality that displays information about the data point closest to the cursor. This feature allows users to quickly interpret complex datasets without needing to manually search for specific values, making interactions more intuitive and efficient. Especially in dense data plots or interactive dashboards, this real-time feedback enables deeper insight and more precise decision-making, which is critical in applications involving financial data, scientific analysis, or operational monitoring.
To see a full list of what's new in 2025 Volume 1, see our release notes.
Syncfusion Essential Studio ASP.NET Core is available as part of Syncfusion Essential Studio Enterprise which is licensed per developer starting with a Team License of up to five developers. It is available as a 12 Month Timed Subscription License which includes support and maintenance. See our Syncfusion Essential Studio Enterprise licensing page for full details.
Learn more on our Syncfusion Essential Studio ASP.NET Core product page.
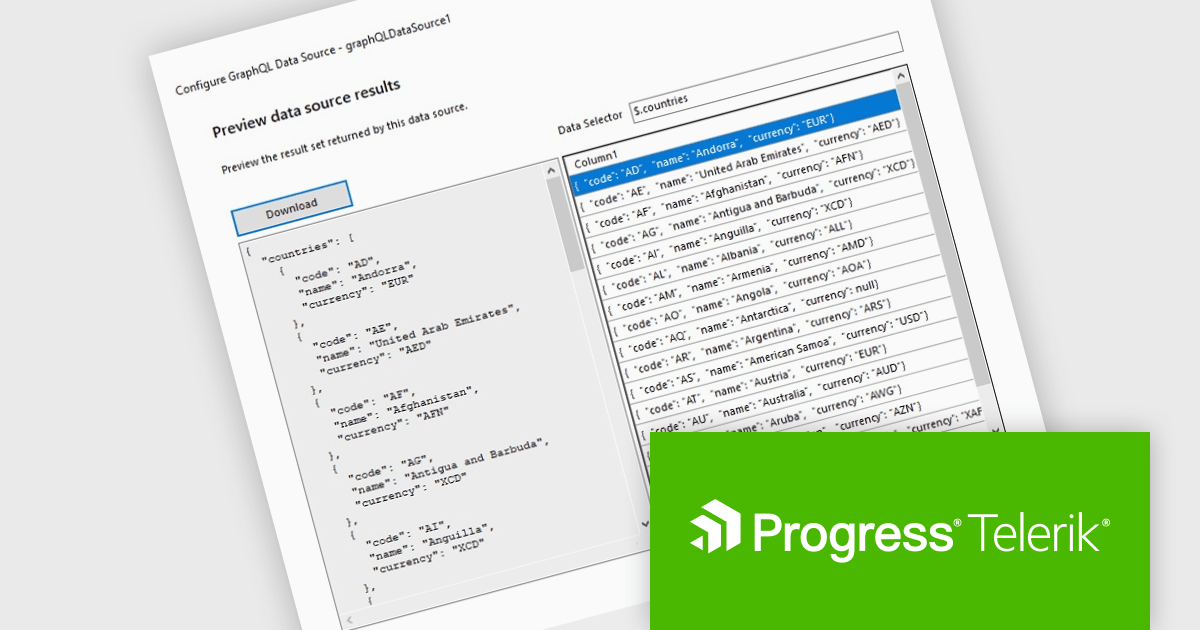
Telerik Reporting is a comprehensive and lightweight embedded reporting tool for .NET web and desktop applications. It enables developers and reporting users to create, design, and export visually appealing, interactive, and reusable reports to effectively present analytical and business data. It supports various technologies, including ASP.NET Core, Blazor, ASP.NET MVC, ASP.NET AJAX, HTML5/JS, Angular, WPF, WinForms, and WinUI.
The Telerik Reporting 2025 Q1 update introduces GraphQL native support with a dedicated GraphQLDataSource component, allowing developers to seamlessly connect reports to GraphQL APIs. This enhancement streamlines data retrieval by enabling precise queries that fetch only the necessary information, optimizing performance and reducing overhead. The Standalone Report Designer now includes an intuitive wizard that simplifies the setup process, guiding users through creating and configuring GraphQL data sources with minimal effort. By integrating GraphQL natively, Telerik Reporting enhances flexibility and efficiency, empowering developers to build dynamic, data-driven reports with greater ease and precision.
To see a full list of what's new in 2025 Q1 (19.0.25.211), see our release notes.
Telerik Reporting is licensed per developer and is available as a perpetual license with a one year support subscription, which is offered in three tiers: Lite, Priority or Ultimate. See our Telerik Reporting licensing page for full details.
Telerik Reporting is available to buy in the following products:
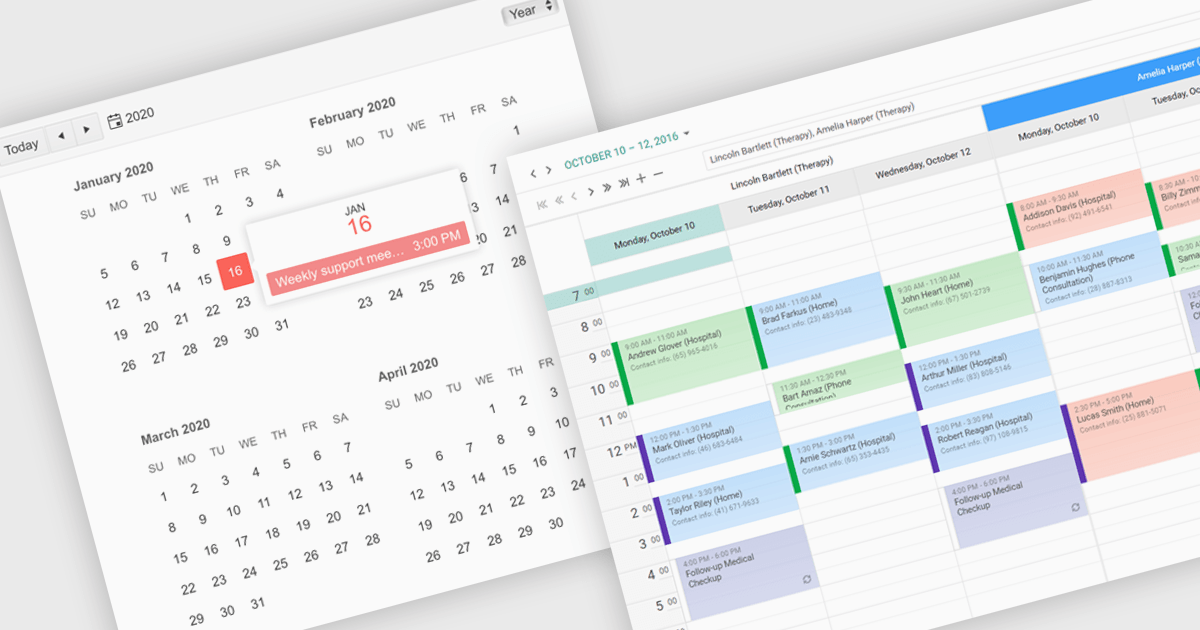
ASP.NET UI suites with calendar components allow users to select dates or date ranges within an application. By providing a visual and intuitive method for date input, calendars reduce user errors, improve data accuracy, and enhance the overall user experience. They are particularly useful in applications involving scheduling, booking, form submissions, or data filtering, such as hotel reservation systems, event management platforms, employee leave trackers, and reporting dashboards. Its inclusion in a UI suite enables developers to implement reliable and accessible date selection features efficiently across projects.
Several ASP.NET UI suites offer a calendar component including:
For an in-depth analysis of features and price, visit our ASP.NET UI suites comparison.
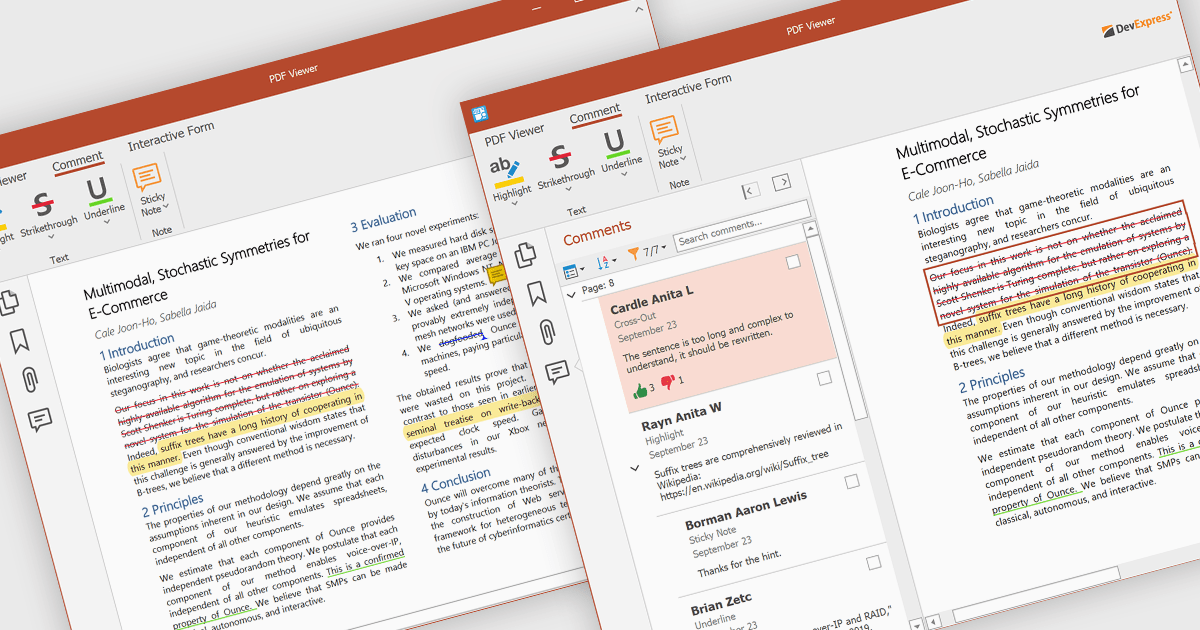
PDF sticky note annotations allow developers to enable users to attach virtual notes to specific locations within a PDF document. These annotations appear as icons that can be clicked to reveal additional text-based comments or instructions. This feature is particularly useful for collaborative workflows, review processes, and documentation tasks, as it enables users to provide contextual feedback without altering the original content. For developers, it offers a straightforward way to integrate lightweight commenting functionality into document-centric applications, enhancing usability and facilitating more efficient communication among users.
Several ASP.NET Core PDF components offer sticky note annotations including:
For an in-depth analysis of features and price, visit our ASP.NET Core PDF components comparison.
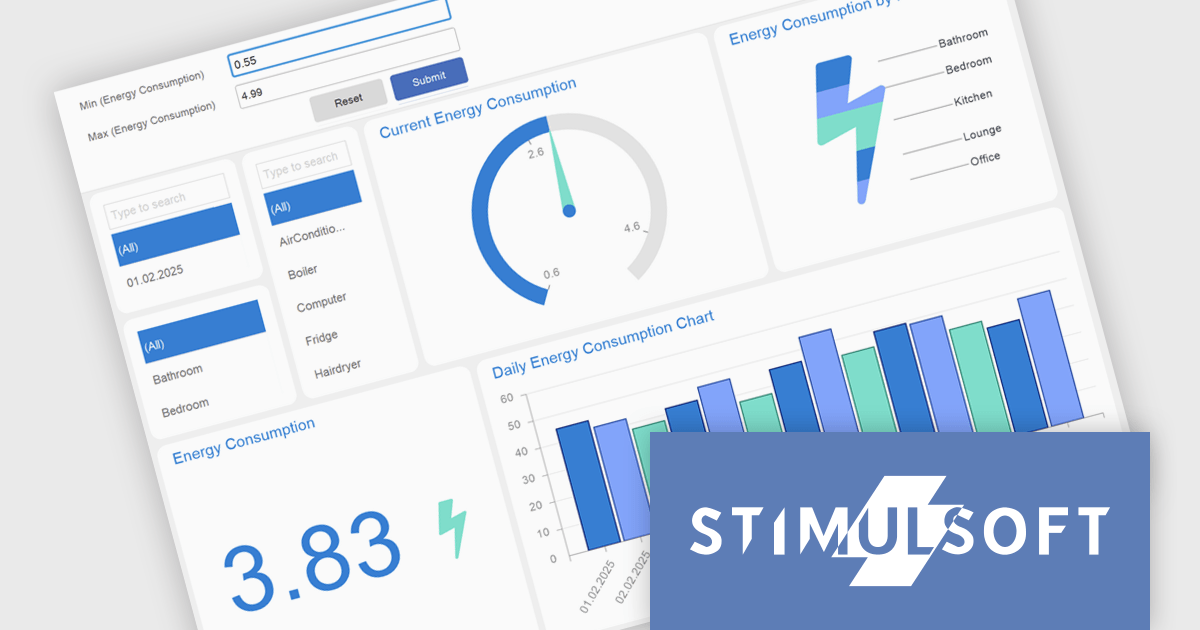
Stimulsoft Dashboards.WEB is a versatile suite of tools for crafting interactive data visualizations for web and desktop applications. It empowers developers to embed intuitive dashboards across various platforms, using the platform-specific components or a centralized cloud designer. With rich data analysis elements, extensive customization options, and pre-built templates, Stimulsoft Dashboards helps you transform complex data into clear, actionable insights for any audience.
The Stimulsoft Dashboards.WEB 2025.2.1 update introduces support for expressions in Gauge range fields, enabling developers to calculate minimum and maximum range bounds dynamically based on underlying data. This enhancement allows for greater flexibility in building responsive dashboards, as Gauge elements can now reflect real-time values without requiring manual adjustments. By integrating expressions directly into the range logic, developers can implement more sophisticated data visualizations that adapt to changing inputs and business logic. This feature streamlines development and supports more efficient maintenance of dynamic reporting scenarios.
To see a full list of what's new in 2025.2.1, see our release notes.
Stimulsoft Dashboards.WEB is licensed per developer and is available as a perpetual license with 1 year support and maintenance. See our Stimulsoft Dashboards.WEB licensing page for full details.
Stimulsoft Dashboards.WEB is available individually or as part of Stimulsoft Ultimate.


Tel: (888) 850 9911
Fax: +1 770 250 6199


