








Official Supplier
As official and authorized distributors, we supply you with legitimate licenses directly from 200+ software publishers.
See all our Brands.
Aspose.PDF for Node.js via C++ empowers developers to leverage the functionality of Aspose.PDF for C++ within their Node.js applications. This bridge library, built on WebAssembly technology, grants Node.js environments the ability to manipulate PDF documents directly on the web server. It provides a comprehensive suite of features for working with PDFs, including creation, editing, merging, splitting, and conversion to various formats.
This solution unlocks a multitude of benefits for Node.js developers. Aspose.PDF for Node.js via C++ streamlines the process of generating complex PDF documents on the server-side, eliminating the need for browser-based rendering. It also facilitates seamless PDF manipulation within Node.js applications, enabling developers to integrate functionalities like form filling, watermarking, and security management directly into their workflows. This translates to enhanced flexibility, performance, and control over PDF processing within Node.js.
Aspose.PDF for Node.js via C++ is offered as Developer Small Business, Developer OEM, Developer SDK, Site Small Business, Site OEM, and Site SDK licenses catering to a range of business needs. Licenses are perpetual, and include 1 year of support and maintenance. Subscription renewals are also available. See our Aspose.PDF for Node.js via C++ licensing page for full details.
Aspose.PDF for Node.js via C++ is available in the following products:
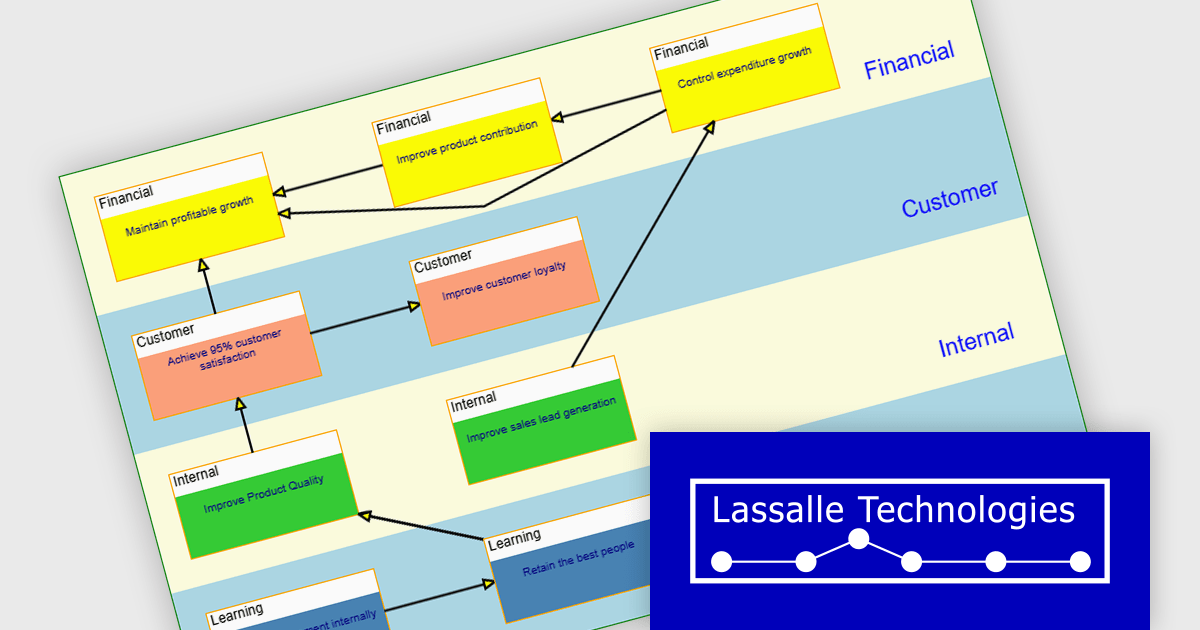
AddFlow Script by Lassalle Technologies is a web-based diagramming component designed for web developers. It empowers users to create interactive flowcharts directly within JavaScript or TypeScript applications. This versatile component allows for the programmatic or interactive generation of two-dimensional diagrams which consist of connected nodes and links.
Primary benefits of AddFlow Script include its ease of use and comprehensive customization options. Due to its lightweight design and royalty-free runtime distribution, developers can seamlessly integrate this flowchart functionality into their web applications. This allows developers to creating a wide range of visualizations, including workflow diagrams, database structures, communication networks, and even quality control charts. Essentially, any process or system that can be broken down into steps and connections can be effectively represented using AddFlow Script.
AddFlow Script is licensed per developer and is runtime royalty free. Site and Enterprise License options are also available. See our AddFlow Script licensing page for full details.
Learn more on our AddFlow Script product page.
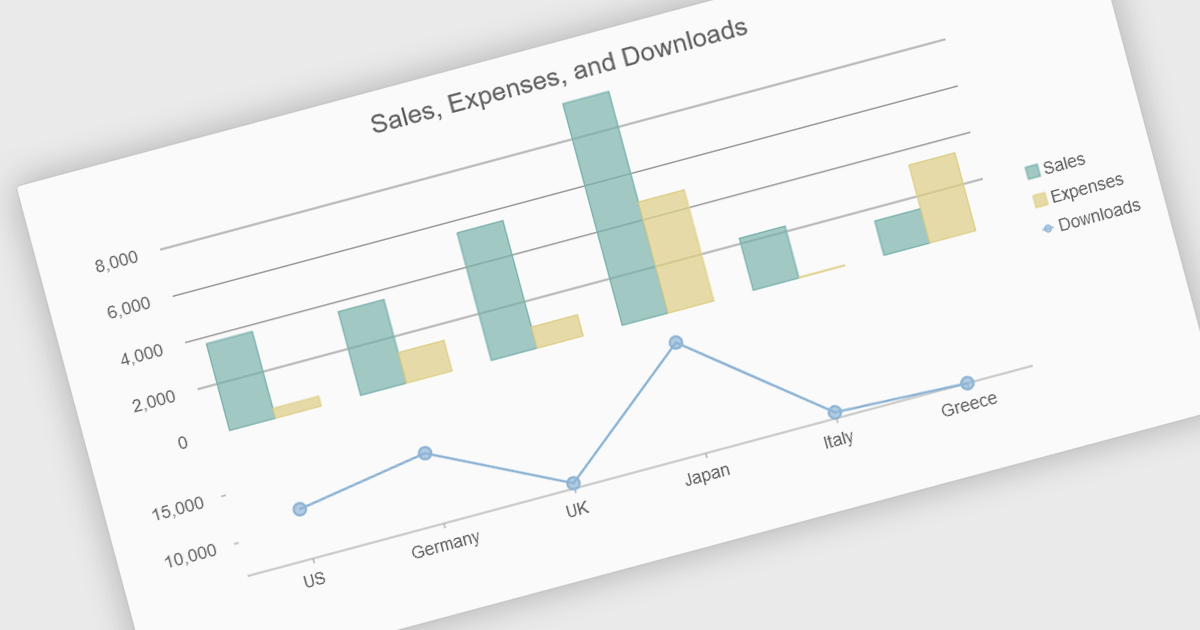
Combination charts (also known as combo charts) are visualizations that integrate multiple chart types, such as bar, line, and area charts, within a single display. This approach allows developers to show varied data sets and relationships in a cohesive, comprehensive manner, facilitating more nuanced data analysis and comparison. The primary benefits include their ability to convey complex information efficiently, their flexibility in showcasing different data trends simultaneously, and their enhanced readability for end-users who need to interpret diverse metrics at a glance. This versatility makes combination charts an invaluable tool for presenting multifaceted data insights in dynamic, interactive web applications.
Several JavaScript / HTML5 chart controls offer combination charts including:
For an in-depth analysis of features and price, visit our comparison of JavaScript / HTML5 Chart Controls.
Stimulsoft Reports.JS provides a robust reporting toolkit designed specifically for JavaScript applications. This library leverages a client-side architecture, offering a pure JavaScript report engine for efficient report rendering directly within web browsers. The solution includes a user-friendly report designer for building reports with various data sources and visualizations, along with a report viewer for seamless integration and display within your JavaScript applications. This eliminates the need for server-side dependencies or browser plugins, simplifying the development process for embedding powerful reporting functionalities into your web projects.
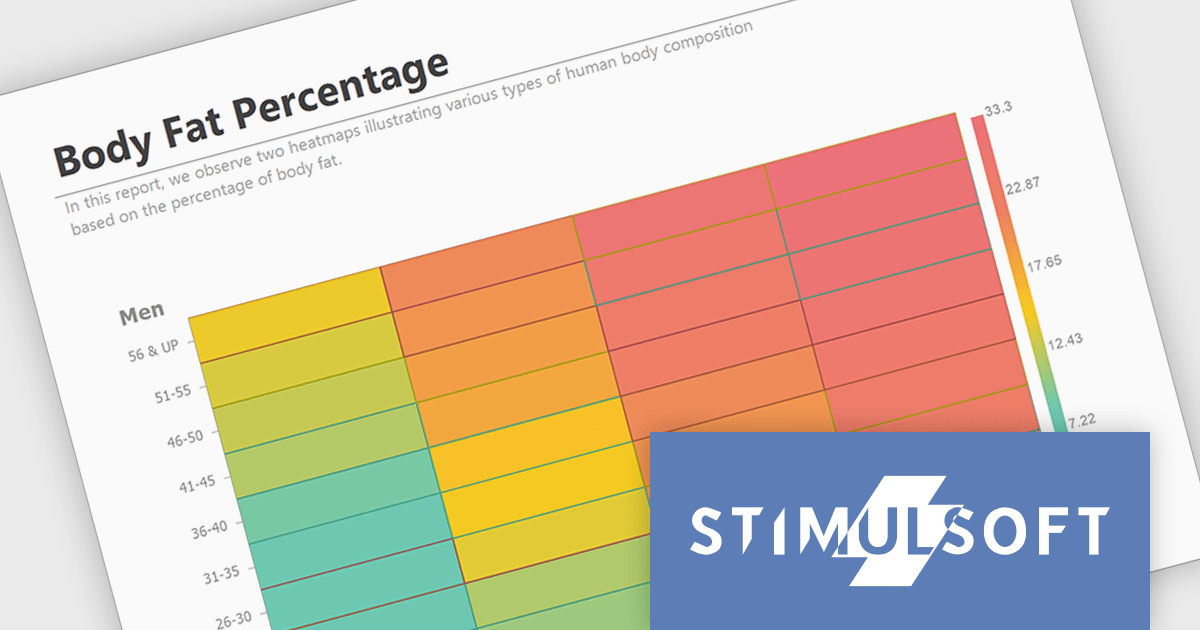
The Stimulsoft Reports.JS 2024.3 update adds a powerful new data visualization tool: the heatmap chart. This intuitive chart type excels at revealing patterns and trends within large datasets. By visually encoding data values through color gradients, heatmaps simplify complex information, allowing users to quickly identify areas of high, medium and low concentration. Stimulsoft Reports.JS seamlessly integrates heatmaps into your existing reporting workflows, enhancing data exploration and communication for your users.
To see a full list of what's new in version 2024.3, see our release notes.
Stimulsoft Reports.JS is licensed per developer and is available as a Perpetual license with 1 year support and maintenance. See our Stimulsoft Reports.JS licensing page for full details.
Stimulsoft Reports.JS is available in the following products:

Rating controls for React are user interface components designed to allow users to input and edit rating values, typically represented by stars, numeric values, or other graphical symbols. These controls are essential in applications where user feedback or rating is required, such as e-commerce sites, review platforms, and survey forms. They provide an intuitive, interactive way for users to submit ratings, ensuring that the data is captured accurately and efficiently. These controls often come with customization options to fit the application's design and can handle various events and validations to enhance the user experience and data integrity.
Several React data editor collections offer Rating controls including:
For an in-depth analysis of features and price, visit our comparison of React data editors.





Tel: (888) 850 9911
Fax: +1 770 250 6199


