








Official Supplier
As official and authorized distributors, we supply you with legitimate licenses directly from 200+ software publishers.
See all our Brands.
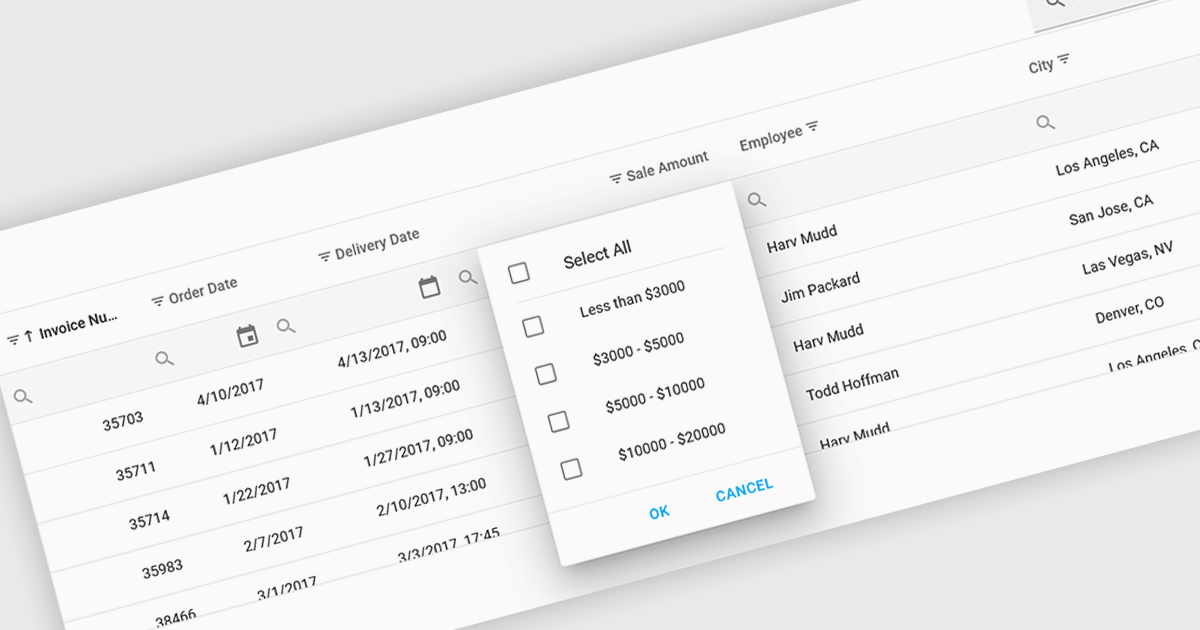
Using a grid control with support for filters enables users to dynamically narrow the displayed data based on specific criteria. This functionality helps users focus on relevant subsets of information by filtering individual columns using operators, keywords, or pre-defined options. Filtering improves data exploration efficiency and reduces cognitive load by presenting only the data that aligns with the user's current analysis.
Several React grid controls offer filtering functionality including:
For an in-depth analysis of features and price, visit our React Grid controls comparison.
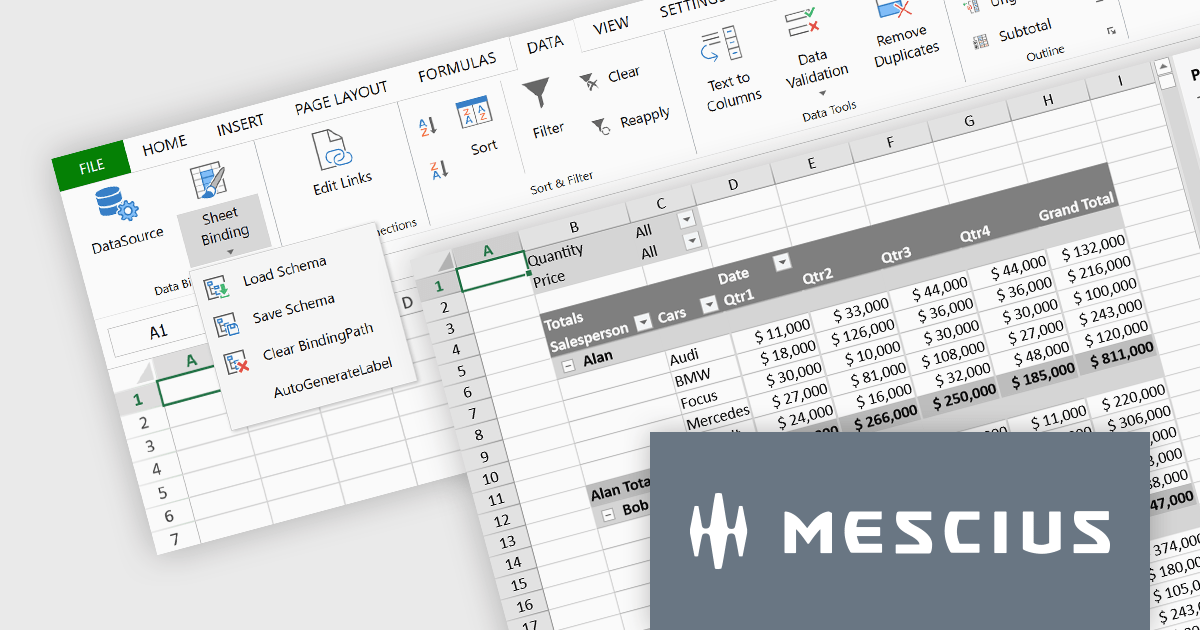
SpreadJS is a complete enterprise JavaScript spreadsheet solution used to create financial reports and dashboards, budgeting and forecasting models, scientific, engineering, healthcare, education, science lab notebooks, and other similar JavaScript business applications. Leverage the high-speed calculation engine with over 500 Excel built-in functions in 19 languages, to deliver true Excel-like spreadsheet experiences with zero dependencies on Excel. Fully customize your application’s needs with SpreadJS’s optional deployment add-on components for Pivot Tables UI, and an Excel-like Designer ribbon, allowing your users to perform complex interactive analysis and data visualization.
MESCIUS has created a brief but informative video blog that highlights the functionality of these powerful add-ons:
View the Video Blog and learn how to effortlessly upgrade your JavaScript spreadsheets.
SpreadJS is licensed per developer and includes 1 Year Maintenance (major and minor version releases and unlimited support phone calls). SpreadJS requires an Annual or Perpetual Deployment License. The optional Add-ons are available at an additional cost, and require a SpreadJS license. See our SpreadJS licensing page for full details.
For more information, visit our SpreadJS product page.
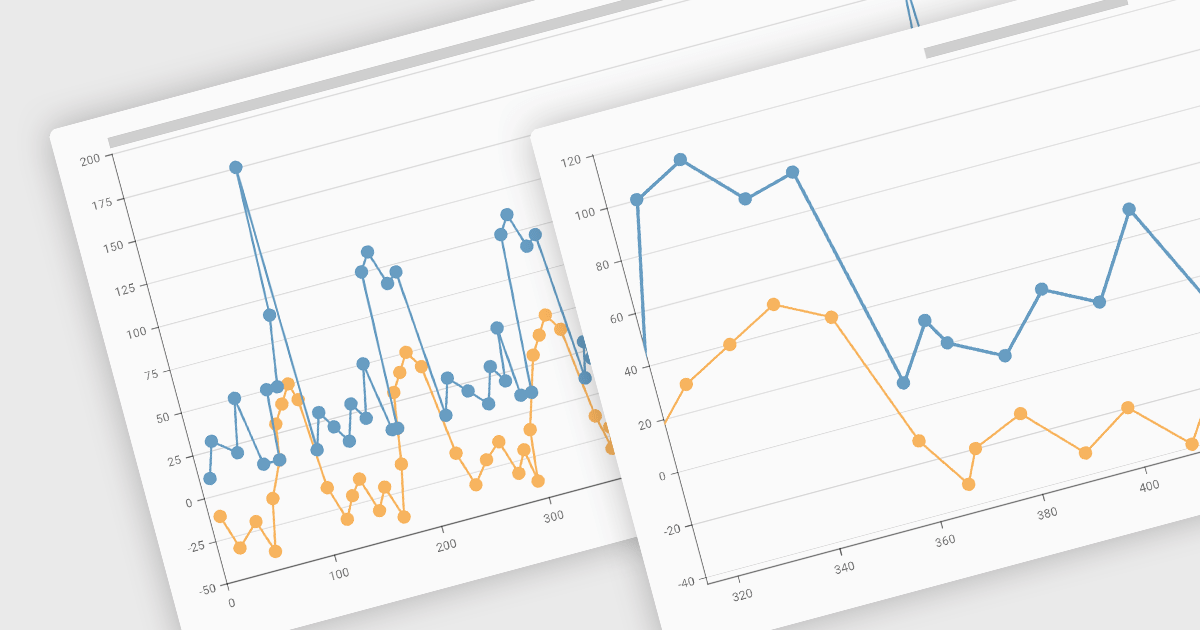
Zooming functionality in a chart component empowers users to delve deeper into complex datasets. By allowing for magnified views of specific areas, users can identify trends, outliers, and patterns that might be obscured in a broader, more generalized view. This interactivity fosters a richer understanding of the data and facilitates more informed decision-making for end users.
Several Vue.js chart controls support zooming including:
For an in-depth analysis of features and price, visit our comparison of Vue.js Charts.
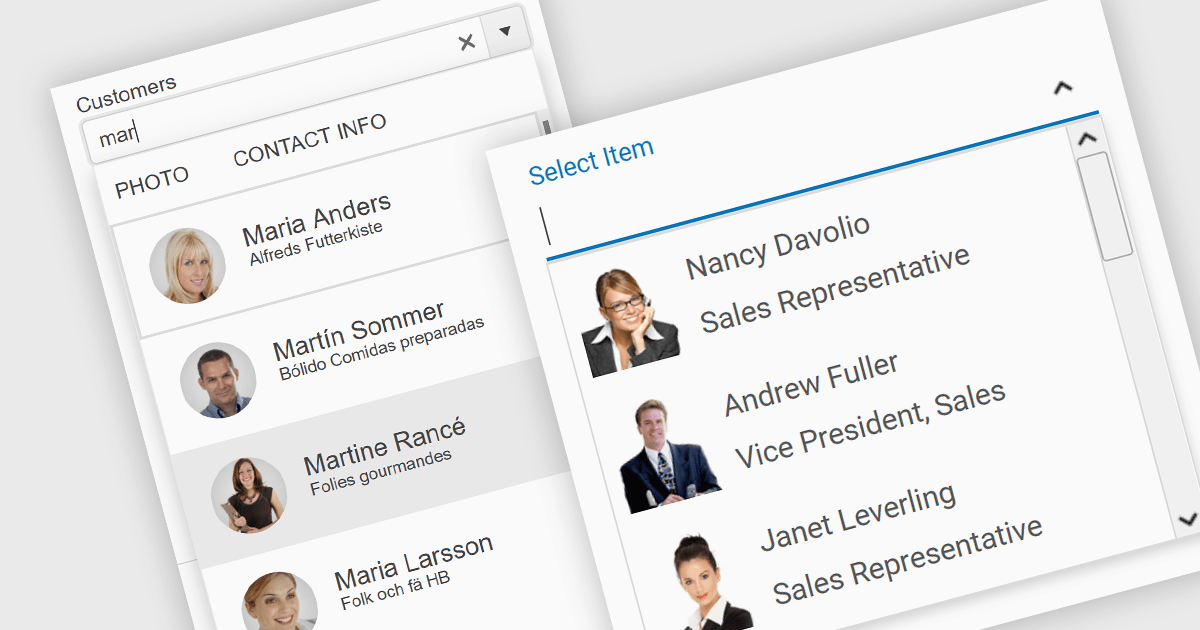
An image combobox is a custom UI component that combines a traditional dropdown menu with the ability to display an image alongside each item. Image comboboxes can enhance user experience by providing a more intuitive way to identify and select options, especially for items that benefit from visual representation. This approach can be particularly useful for non-text-based data or for catering to users who prefer visual cues.
Several JavaScript Data Editor controls support image combobox functionality including:
For an in-depth analysis of features and price, visit our comparison of JavaScript Data Editors.
Aspose.PDF for JavaScript via C++ is a toolkit that empowers developers to manipulate PDF files directly within web browsers. Built on WebAssembly technology, it offers a secure and scalable solution for adding features like generation, viewing, editing, and conversion of PDFs to your JavaScript applications. This library, written in C++, eliminates the need for additional runtime environments, ensuring broad browser compatibility.
The Aspose.PDF for JavaScript via C++ V24.3 release adds a new AsposePdfFromImage API that allows you to convert image files to PDF format. This easy-to-use API grants developers the ability to integrate and automate the transformation of PNG, JPG, BMP, GIF, and TIFF files into universally accessible, secure, and easily manageable PDF files within web and desktop applications.
To see a full list of what's new in Aspose.PDF for JavaScript via C++, see our release notes.
Aspose.PDF for JavaScript via C++ is offered as Developer Small Business, Developer OEM, Developer SDK, Site Small Business, Site OEM, and Site SDK licenses catering to a range of business needs. Licenses are perpetual, and include 1 year of support and maintenance. Subscription renewals are also available. See our Aspose.PDF for JavaScript via C++ licensing page for full details.
Aspose.PDF for JavaScript via C++ is available in the following products:





Tel: (888) 850 9911
Fax: +1 770 250 6199


