








Official Supplier
As official and authorized distributors, we supply you with legitimate licenses directly from 200+ software publishers.
See all our Brands.
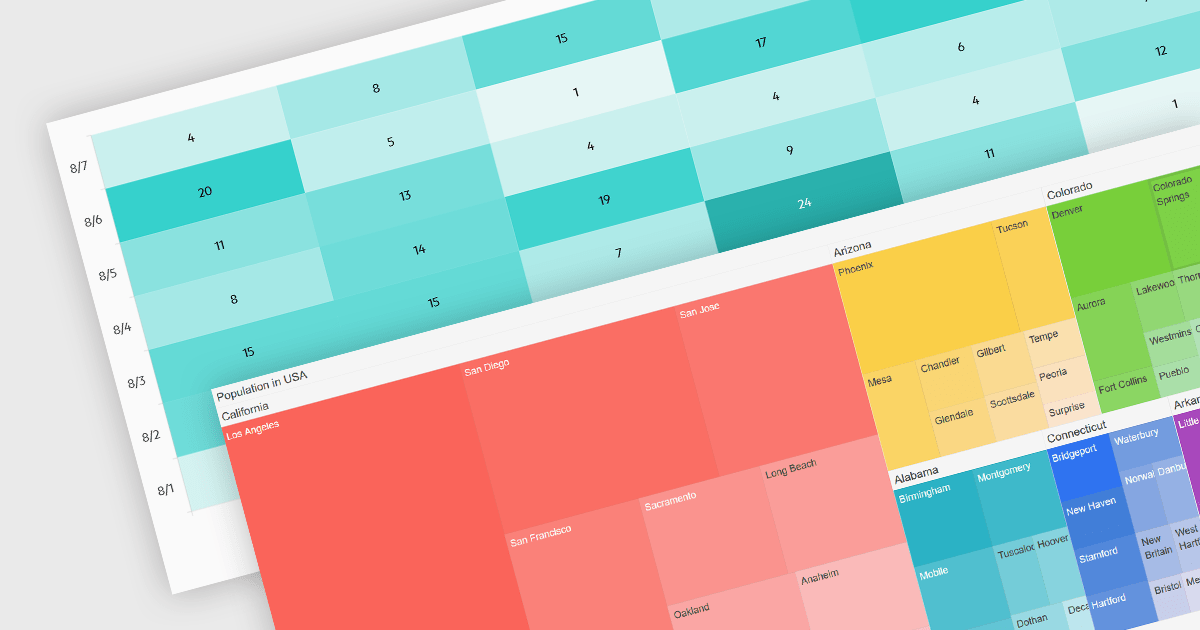
Heatmaps and treemaps are powerful data visualization tools that offer specific advantages when examining large datasets. A heatmap colorizes data values in a matrix, allowing for intuitive observation of trends, patterns, and outliers over two dimensions, making it helpful for spatial data analysis and correlation assessment. Treemaps exhibit hierarchical data as nested rectangles, with size and color variations indicating distinct quantitative values, allowing for effective use of space and fast comparison of proportions and relationships within hierarchical structures. Together, these chart types provide significant tools for visualizing and interpreting complex data, improving decision-making processes by presenting underlying data insights in a clear and actionable manner.
Several jQuery chart controls support the Heat and Treemap chart types, including:
For an in-depth analysis of features and price, visit our comparison of jQuery chart controls.
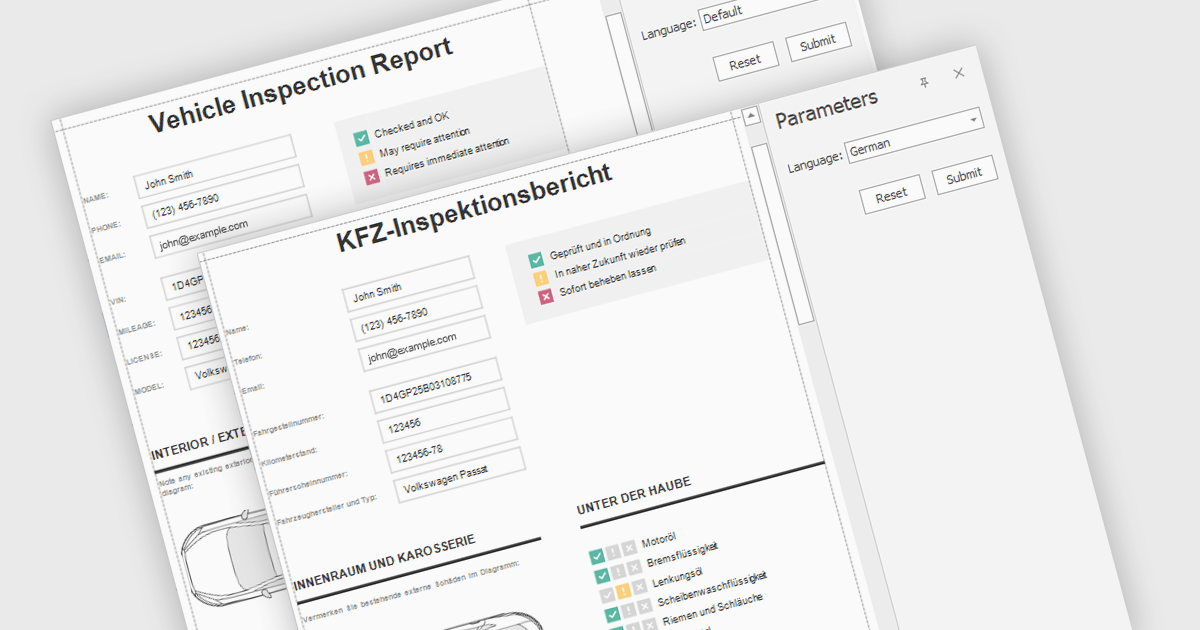
Report localization is the process of adapting a report for a target audience's language and cultural context. This involves translating text elements, formatting dates and currencies appropriately, and potentially adjusting the user interface to accommodate different reading habits such as right-to-left layouts. The goal is to ensure the report is clear, informative, and culturally sensitive for users worldwide.
Several React reporting controls offer localization including:
For an in-depth analysis of features and price, visit our React reporting controls comparison.
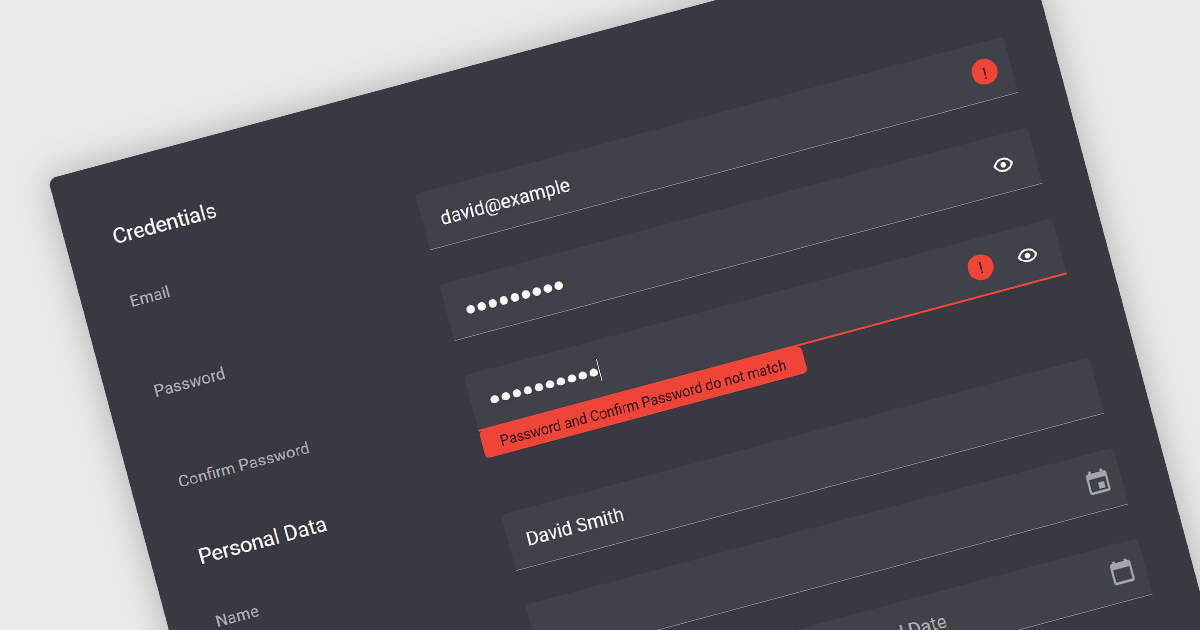
Validation in data editor controls refers to the process of ensuring user-entered information conforms to predefined rules. This helps prevent invalid or erroneous data from being stored in your application. By implementing data validation, you improve data integrity, reduce the need for manual data cleansing, and ultimately streamline the development process by catching errors early on.
Here are some examples of Vue.js data editors that support data validation:
For an in-depth analysis of features and price, visit our comparison of Vue.js Data Editors.
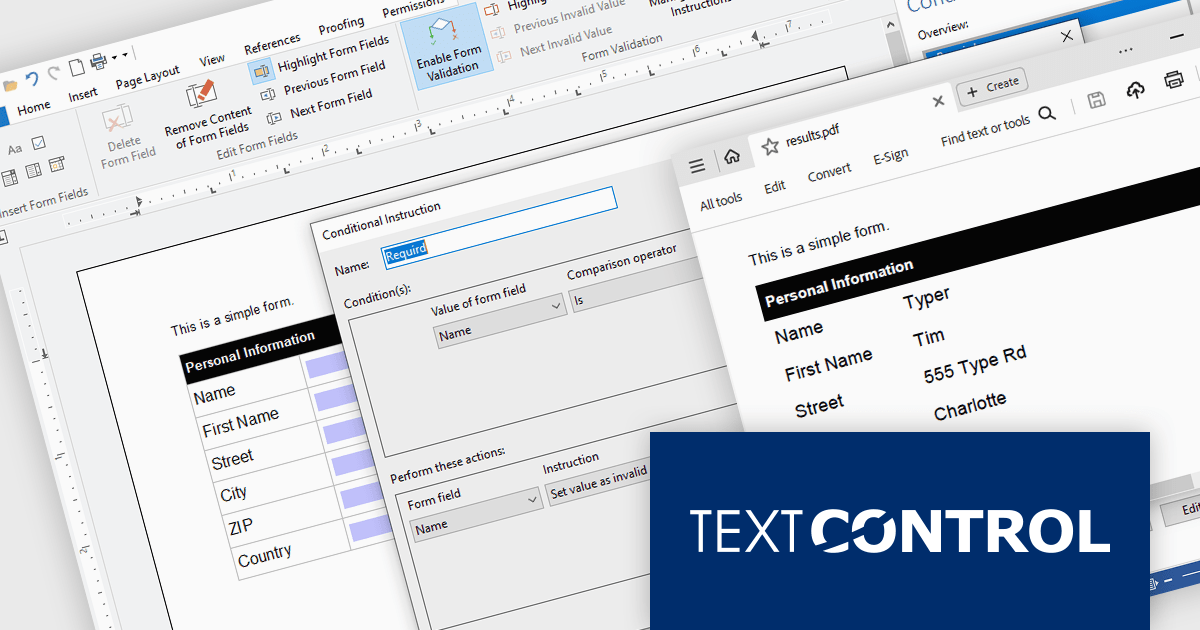
TX Text Control .NET Server for ASP.NET is a server-side component that equips developers with a powerful word processing engine for web applications. It integrates seamlessly with ASP.NET, ASP.NET Core, popular frameworks like Angular and React, and JavaScript, allowing you to build dynamic document editing and generation features directly within your web applications. This empowers you to create documents on the fly using data from various sources, edit existing documents in the browser, and handle functionalities like PDF processing and form filling, all on the server-side.
In this blog post, Text Control's Bjoern Meyer shows you how to use the Document Viewer in your Angular application to allow your users to open a PDF document, enter their data into the form fields, and save the document. Features include:
Read the full blog to get started handling form field data in your Angular apps.
TX Text Control .NET Server for ASP.NET is licensed per Developer and includes Run-time licensing for up to 5 Servers. Licensing is perpetual, and include a 1-year subscription. See our TX Text Control .NET Server for ASP.NET licensing page for more details.
Learn more about TX Text Control .NET Server for ASP.NET.

ONLYOFFICE Docs Enterprise Edition with Confluence Connector combines an online document editor with a seamless integration for Confluence, a centralized platform for project management and collaboration. This allows teams to create, view, edit, and collaborate on spreadsheets, presentations, and text files online, directly within Confluence, boosting efficiency and eliminating the need for file switching.
The ONLYOFFICE Confluence Connector v5.0.0 release (available as part of ONLYOFFICE Docs Enterprise Edition with Confluence Connector v8.0.1) adds functionality allowing you to create complex PDF forms with interactive fields and fill them out online, directly within your Confluence platform. This ability empowers teams to design and distribute easily fillable PDF forms seamlessly within Confluence, collecting valuable data from their users and fostering a more collaborative and productive work environment.
To see a full list of what's new in ONLYOFFICE Docs Enterprise Edition v8.0.1 with Confluence Connector 5.0.0, see our release notes.
ONLYOFFICE Docs Enterprise Edition with Confluence Connector is licensed per server and is available as an annual license with 1 year of support and updates, or as a perpetual license with 3 years of support and updates. See our ONLYOFFICE Confluence connector licensing page for full details.
For more information, see our ONLYOFFICE Confluence Connector product page.





Tel: (888) 850 9911
Fax: +1 770 250 6199


