


Official Supplier
As official and authorized distributors, we supply you with legitimate licenses directly from 200+ software publishers.
See all our Brands.
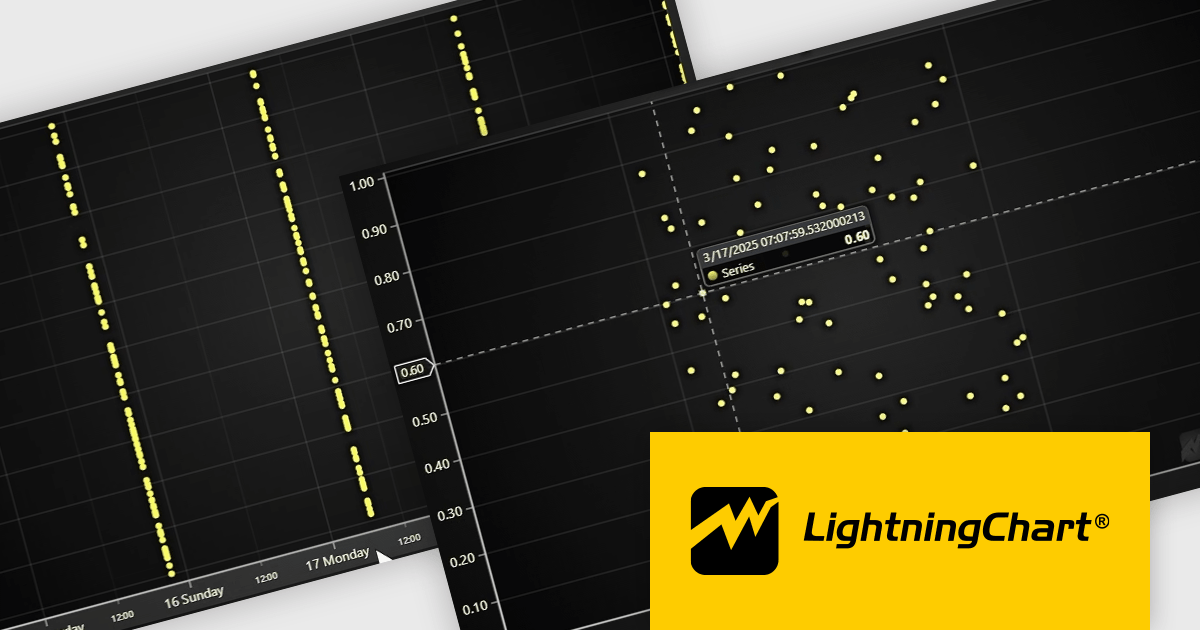
LightningChart JS is a JavaScript/TypeScript library developed by LightningChart that is particularly well-suited for data-intensive visualizations, offering exceptionally fast rendering capabilities thanks to its use of WebGL. This makes it a strong choice for applications that require real-time data updates, such as financial platforms, engineering tools, scientific research dashboards, and industrial monitoring systems. It provides high-performance, 2D, 3D, and real-time charting controls and a comprehensive suite of visualizations including candlestick, bar, line, and various technical indicators and drawing tools. This library enables software developers to craft interactive technical analysis tools without the need for server-side setup as it runs completely on the client device.
The LightningChart JS v7.1 update enhances its Date-Time axis capabilities by introducing support for nanosecond-resolution timestamps, allowing users to zoom into microsecond and nanosecond ranges for more granular time-based data analysis—well beyond the previous millisecond limitations. To utilize this feature, timestamps should generally be supplied as BigInt64. This update positions LightningChart JS among the few web charting libraries explicitly supporting nanosecond precision, making it a strong choice for applications requiring high-resolution temporal data visualization.
To see a full list of what's new in v7.1, see our release notes.
LightningChart JS is licensed per developer and is available as an annual license with 1 year support. See our LightningChart JS licensing page for full details.
For more information, see our LightningChart JS product page.
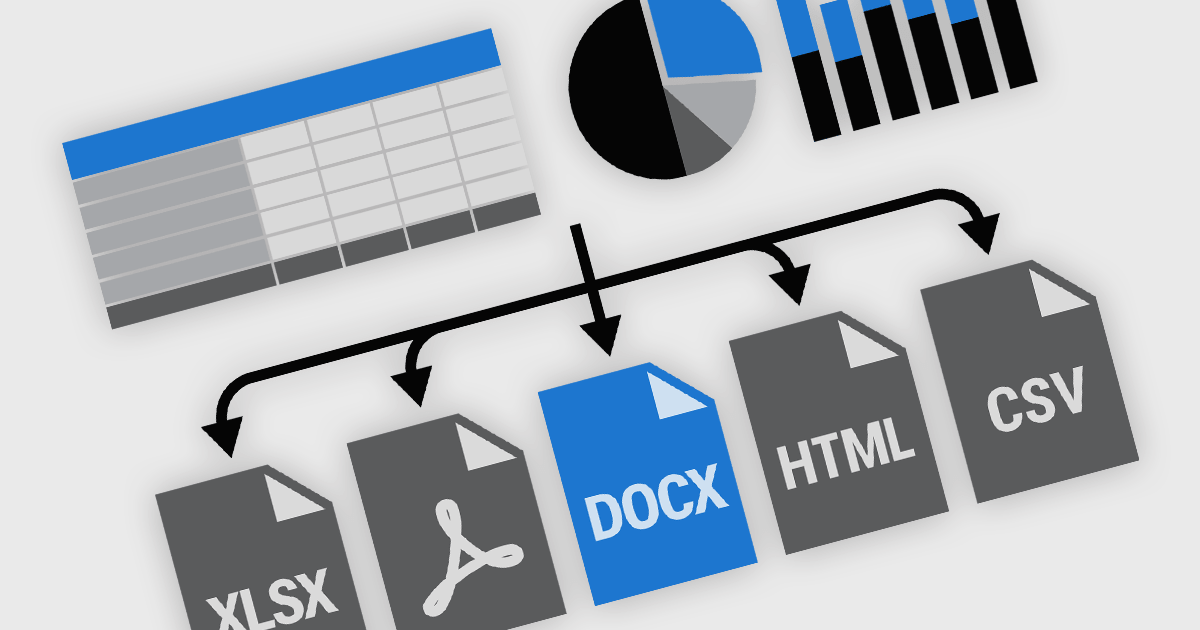
Exporting and printing functionality in reporting components is a core requirement for many software applications, particularly those used in business, finance, and analytics. These capabilities enable users to transform dynamic, on-screen reports into portable or hard-copy formats suitable for distribution, archiving, or further processing. High-performance reporting tools offer flexible export and print options to accommodate various workflows, whether for regulatory compliance, client communications, or internal documentation. Support for a broad range of output formats ensures that users can interact with report content in the way that best suits their needs.
Common features include:
For an in-depth analysis of features and price, visit our React reporting components comparison.
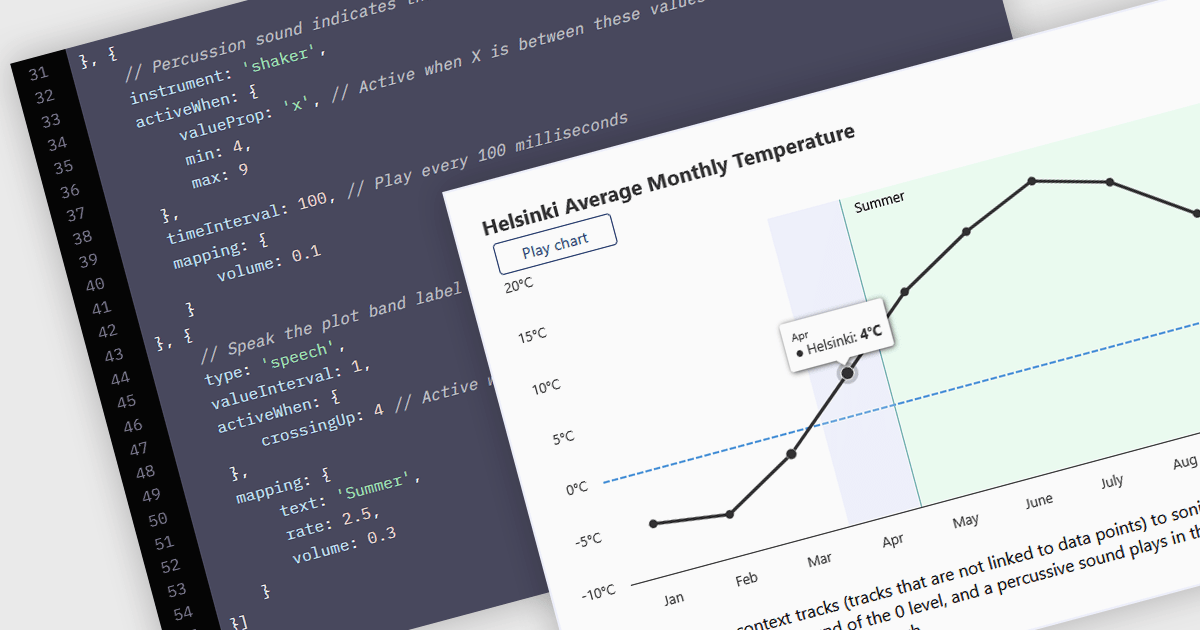
WCAG (Web Content Accessibility Guidelines) compliance in JavaScript charts ensures that visual data representations are accessible to all users, including those with disabilities. This involves implementing features such as semantic markup for assistive technologies, keyboard navigation support, high-contrast color schemes for users with visual impairments, and descriptive alternative text for charts and data points. Additionally, it may include providing data tables or summaries as textual alternatives and ensuring that interactive elements are operable without reliance on a mouse. Achieving WCAG 2.0 compliance enhances usability, meets legal accessibility standards, and promotes inclusive user experiences across web applications.
Several JavaScript chart controls offer WCAG compliance including:
For an in-depth analysis of features and price, visit our comparison of JavaScript Chart Controls.
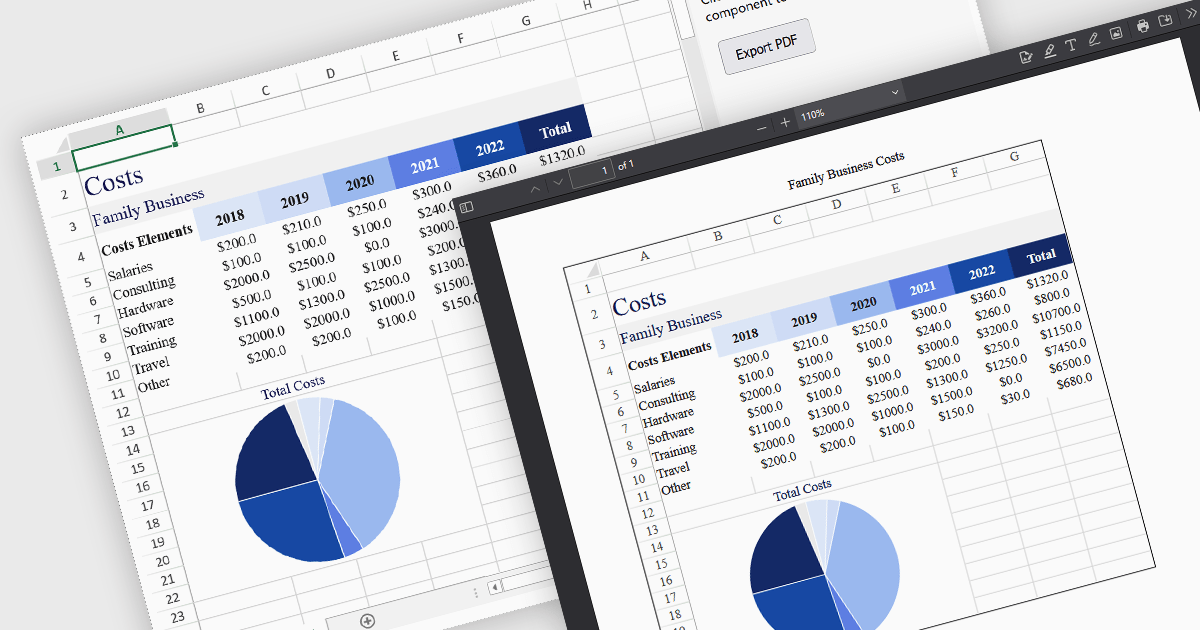
Exporting a spreadsheet to PDF from a JavaScript application is a widely used feature that allows users to generate portable, print-ready documents directly from the browser. It converts the contents of a spreadsheet, such as cell data, formulas, formatting, charts, and images into a Portable Document Format (PDF) file. This capability ensures that the data, formatting, and layout from the original spreadsheet are preserved without relying on external applications or manual intervention. It is particularly useful for generating reports, invoices, or records that need to be shared, printed, or archived in a fixed format. By enabling PDF generation directly within the web application, developers can offer users a straightforward method to archive, print, or share spreadsheet content in a consistent and professional format across devices and platforms.
Several JavaScript spreadsheet components allow you to export to PDF, including:
For an in-depth analysis of features and price, visit our comparison of JavaScript spreadsheet components.
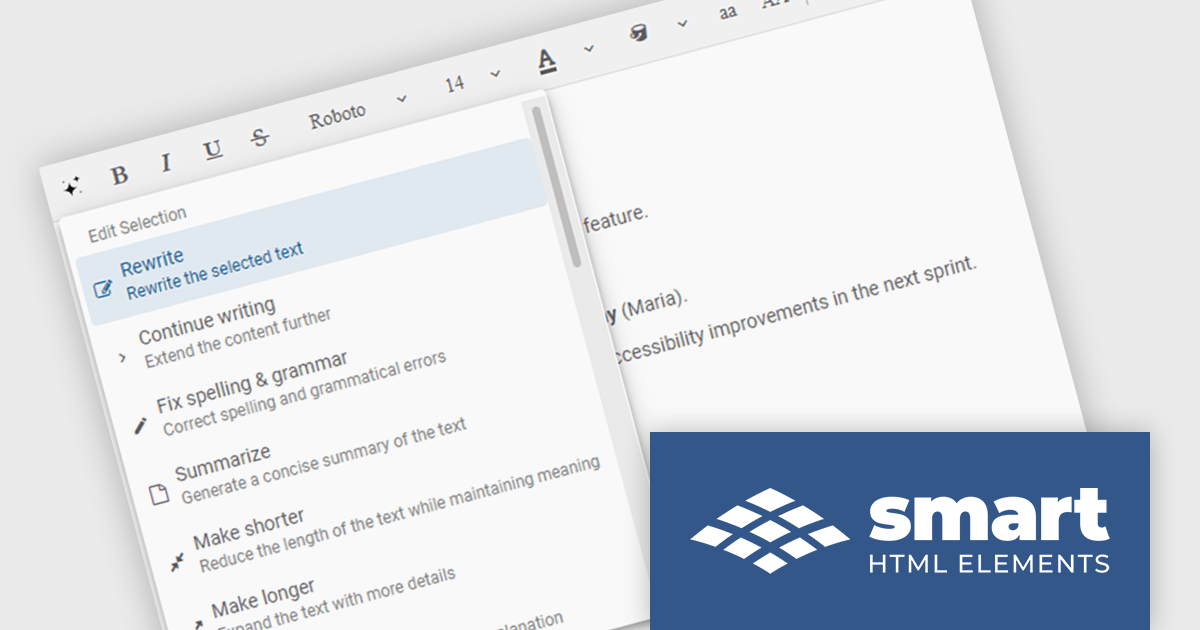
Smart UI by Smart HTML Elements is an enterprise-grade UI library offering pre-built web components for developers in Angular, React, Vue, Blazor, and JavaScript. It boasts over 60 ready-to-use components like grids, charts, schedulers, and editors, all featuring two-way data binding, responsiveness, accessibility, and theming capabilities. This library helps developers rapidly build dynamic and modern web applications with consistent look-and-feel and rich functionalities, accelerating development time and ensuring professional quality.
The Smart UI v23.0.0 release adds new features to Smart.Editor, including content generation, text summarization and the ability to rewrite, expand or shorten content by using AI. These capabilities enable users to quickly craft content, distill lengthy text into key points, and tailor messaging with precision, all without leaving the editing environment. Whether expanding a brief idea into a full paragraph or condensing verbose content for clarity, the new AI tools simplify content creation and editing.
To see a full list of what's new in v23.0.0, see our release notes.
Smart UI (Smart HTML Elements) is licensed per developer and is available as a perpetual license with 1 year support and maintenance. It includes distribution to unlimited Web applications, SaaS projects, Intranets and Websites. Team, OEM and Enterprise licensing options are also available. See our Smart UI (Smart HTML Elements) licensing page for full details.
Learn more on our Smart UI product page.


Tel: (888) 850 9911
Fax: +1 770 250 6199


