


Official Supplier
As official and authorized distributors, we supply you with legitimate licenses directly from 200+ software publishers.
See all our Brands.
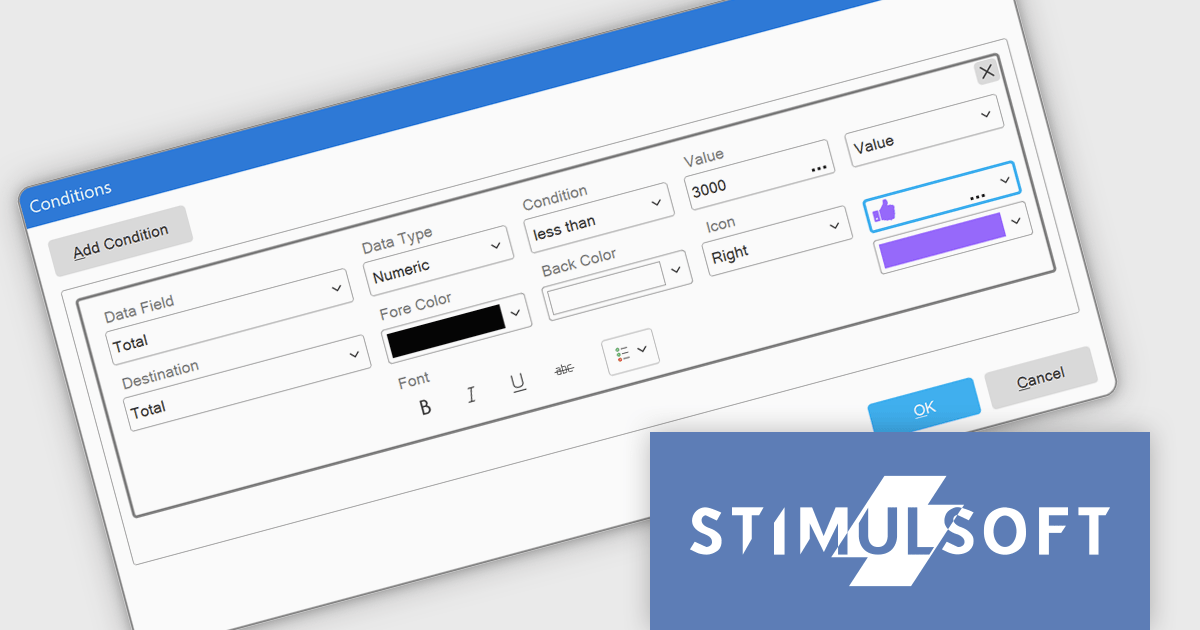
Stimulsoft Dashboards.WEB is a versatile suite of tools for crafting interactive data visualizations for web and desktop applications. It empowers developers to embed intuitive dashboards across various platforms, using the platform-specific components or a centralized cloud designer. With rich data analysis elements, extensive customization options, and pre-built templates, Stimulsoft Dashboards helps you transform complex data into clear, actionable insights for any audience.
The Stimulsoft Dashboards.WEB 2025.1.1 update introduces the ability to apply visual indicators in conditional formatting for table elements, providing users with a powerful tool to enhance data visualization. This feature allows icons or custom uploaded images to be dynamically applied to table cells based on predefined conditions, enabling more precise and intuitive representation of data. By integrating this functionality, developers can create dashboards that effectively highlight critical information, improve data readability, and deliver a more engaging user experience, all while maintaining flexibility for customization and alignment with specific project needs.
To see a full list of what's new in 2025.1.1, see our release notes.
Stimulsoft Dashboards.WEB is licensed per developer and is available as a perpetual license with 1 year support and maintenance. See our Stimulsoft Dashboards.WEB licensing page for full details.
Stimulsoft Dashboards.WEB is available individually or as part of Stimulsoft Ultimate.
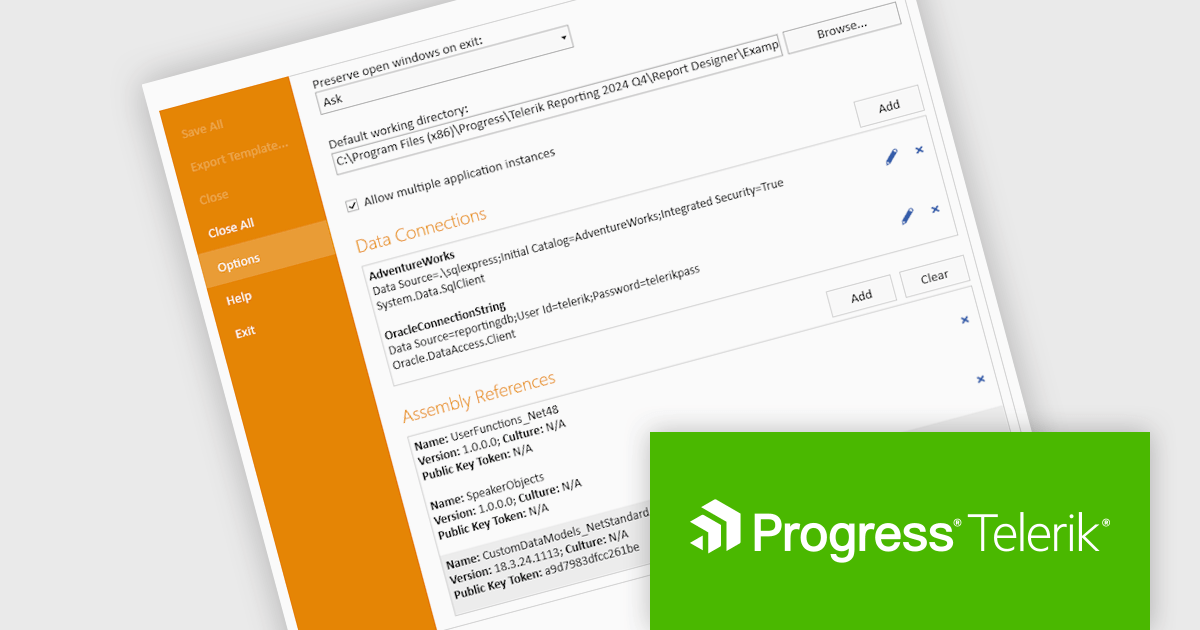
Telerik Reporting is a comprehensive and lightweight embedded reporting tool for .NET web and desktop applications. It enables developers and reporting users to create, design, and export visually appealing, interactive, and reusable reports to effectively present analytical and business data. It supports various technologies, including ASP.NET Core, Blazor, ASP.NET MVC, ASP.NET AJAX, HTML5/JS, Angular, WPF, WinForms, and WinUI.
The Telerik Reporting 2024 Q4 update introduces enhanced Standalone Report Designer tooling, providing developers with a streamlined approach to extending the Standard Report Definition (SRD). This new tooling allows for seamless customization through an intuitive UI, eliminating the need to manually edit configuration files or restart the designer after modifications. By enabling real-time updates and reducing workflow interruptions, this feature enhances development efficiency, minimizes errors, and accelerates iteration cycles, ensuring a more productive and user-friendly reporting experience.
To see a full list of what's new in 2024 Q4 (18.3.24.1112), see our release notes.
Telerik Reporting is licensed per developer and is available as a perpetual license with a one year support subscription, which is offered in three tiers: Lite, Priority or Ultimate. See our Telerik Reporting licensing page for full details.
Telerik Reporting is available to buy in the following products:
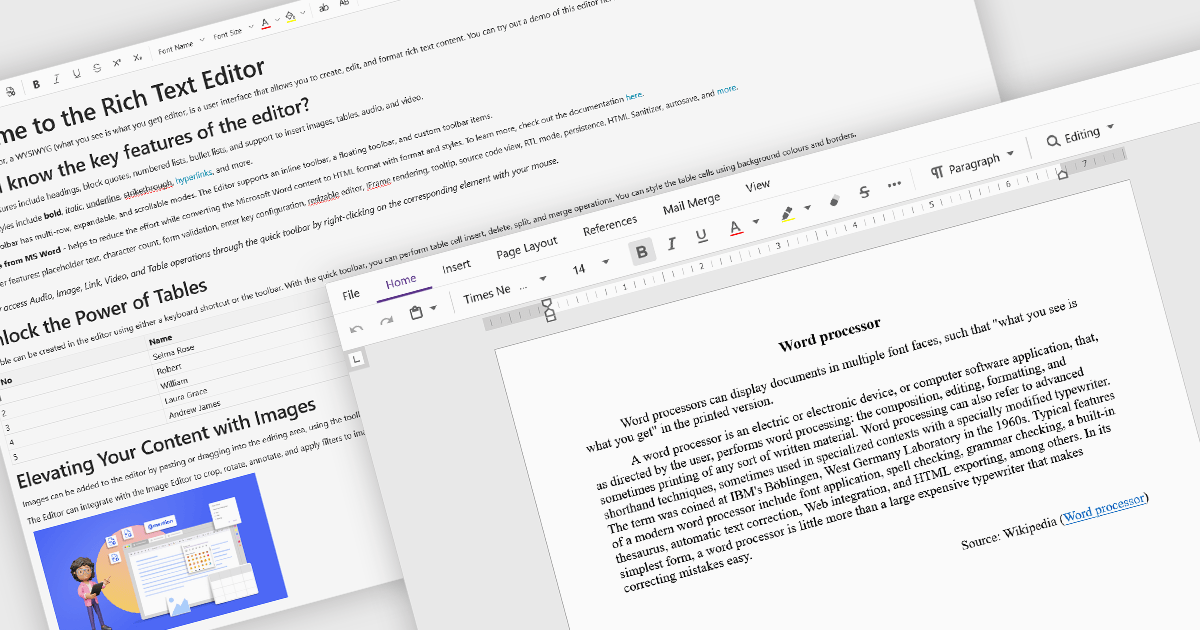
Rich Text Format (RTF) are specialized tools that enable the creation and manipulation of richly formatted text within development environments. The WYSIWYG (What You See Is What You Get) interface allows end users to easily design and format content visually without needing to write code, enhancing usability and reducing the learning curve. These editors commonly offer features such as text formatting, alignment options, list creation, image embedding, and table support, facilitating seamless incorporation of formatted content into applications, documentation, and user interfaces. Benefits include increased productivity, consistent cross-platform formatting, and minimized coding effort for managing text styles. Common use cases involve designing user documentation, generating dynamic web and mobile content, creating rich-text emails, and developing content management systems. By providing intuitive WYSIWYG capabilities, RTF editors are essential for developers aiming to integrate sophisticated text features efficiently into their projects.
Several Blazor data editor collections offer RTF editing capabilities including:
For an in-depth analysis of features and price, visit our Blazor data editors comparison.
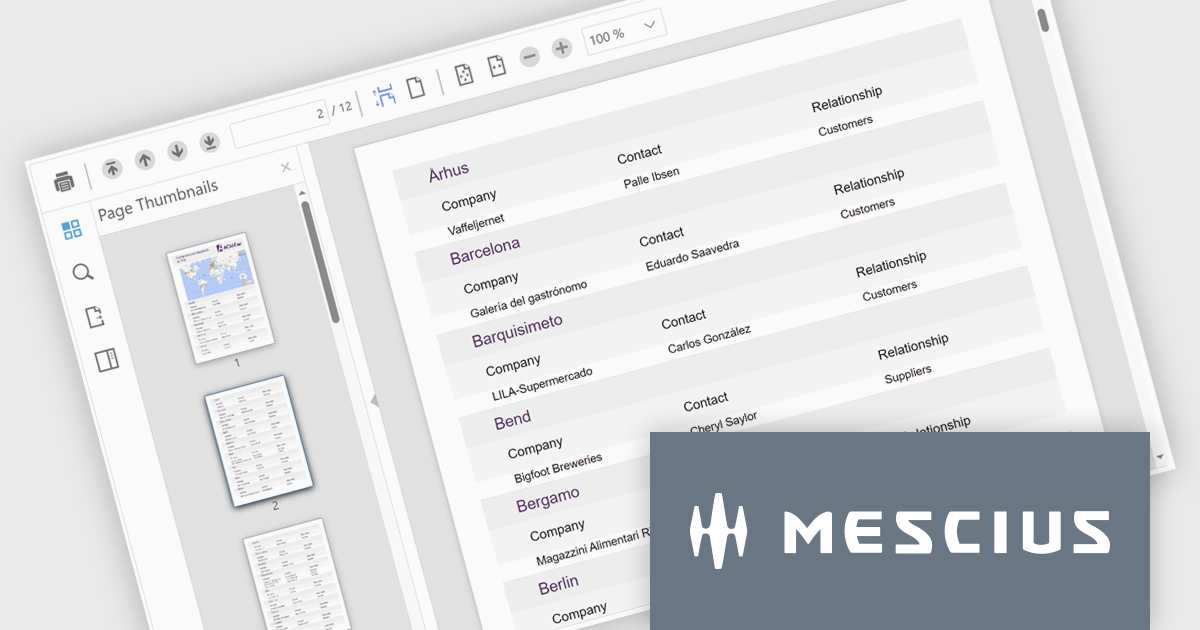
ComponentOne Studio Blazor Edition by MESCIUS empowers developers to leverage their existing C# skills to build rich web applications. This comprehensive suite includes high-performance, native Blazor UI controls like FlexGrid, a powerful datagrid with data virtualization, and 50+ chart types for data visualization. It also offers essential input controls like Autocomplete and Combobox, boosting development efficiency and creating a seamless experience for both developers and users.
The ComponentOne Studio Blazor Edition 2024 v2 update enhances productivity with the production-ready FlexViewer for Blazor Server applications, enabling developers to integrate a powerful cross-platform document and report viewer into their projects. This update introduces essential features such as a document outline for streamlined navigation, a page setup panel for effortless customization, and interactive report parameters for dynamic filtering. These additions simplify the management and presentation of complex documents and reports while ensuring a seamless user experience.
To see a full list of what's new in 2024 v2, see our release notes.
ComponentOne Studio Blazor Edition is licensed per developer on a perpetual basis and includes a 12 month subscription. See our ComponentOne Studio Blazor Edition licensing page for full details.
ComponentOne Studio Blazor Edition is available individually or as part of ComponentOne Studio Enterprise.
Syncfusion Essential Studio Blazor (available as part of Syncfusion Essential Studio Enterprise) is a comprehensive UI component library designed to accelerate the development of high-performance, modern web applications using the Blazor framework. It boasts over 85+ responsive, lightweight, and modular components spanning various categories such as data visualization, data editing, document processing, and interactive UI elements. This rich repertoire empowers developers to rapidly build user-friendly, feature-rich web interfaces, with seamless integration of both server-side and client-side Blazor applications.
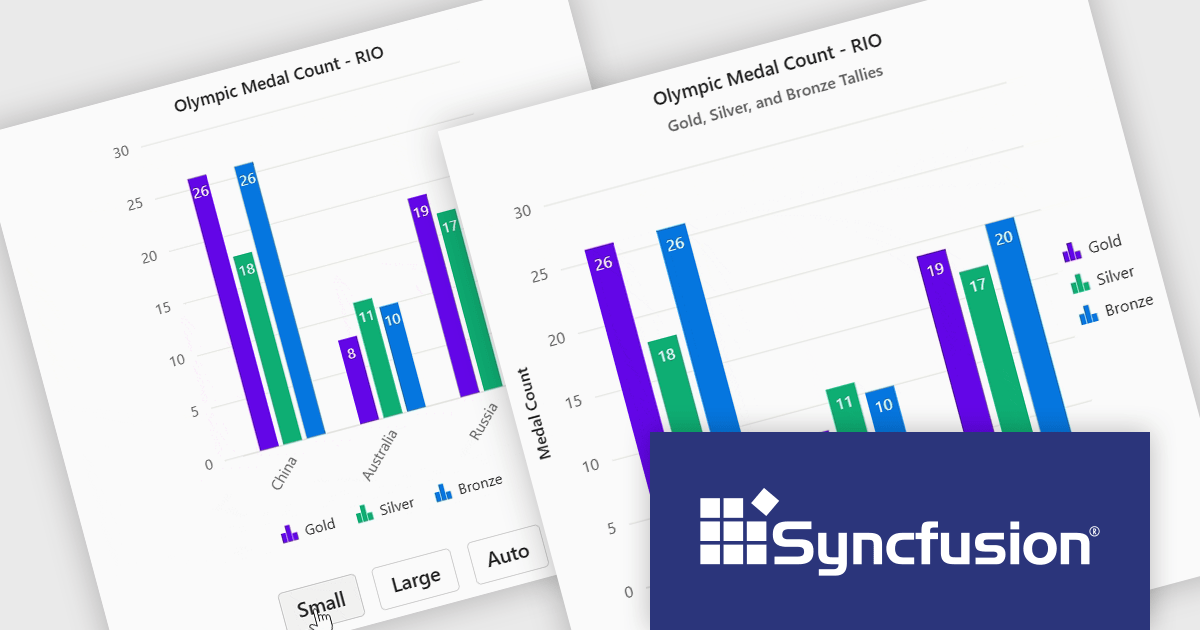
The Syncfusion Essential Studio Blazor 2024 Volume 4 release introduces adaptive layout support for charts, enhancing their responsiveness across various screen sizes. This feature ensures that chart elements, including axis labels, titles, legends, and data labels, dynamically adjust their design and positioning to maintain clarity and readability on different devices. By automatically optimizing the arrangement of these components, the adaptive layout improves user experience, making data visualization more effective and accessible across desktops, tablets, and smartphones.
To see a full list of what's new in 2024 Volume 4, see our release notes.
Syncfusion Essential Studio Blazor is available as part of Syncfusion Essential Studio Enterprise which is licensed per developer starting with a Team License of up to five developers. It is available as a 12 Month Timed Subscription License which includes support and maintenance. See our Syncfusion Essential Studio Enterprise licensing page for full details.
Learn more on our Syncfusion Essential Studio Blazor product page.


Tel: (888) 850 9911
Fax: +1 770 250 6199


